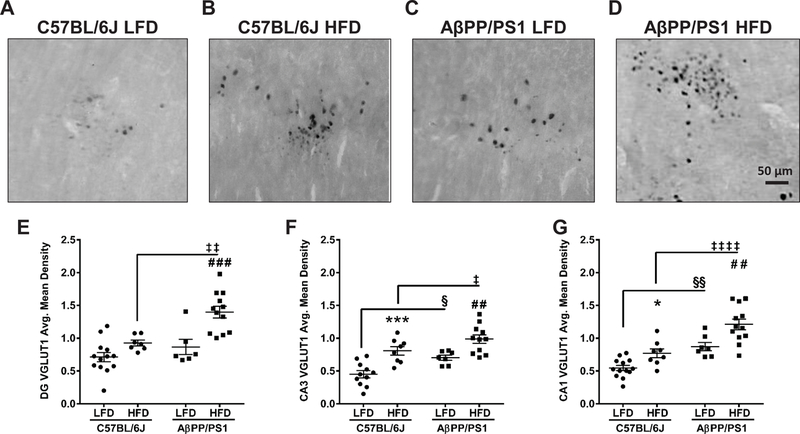
Figure 5: VGLUT1 Immunohistochemistry.

Representative images of VGLUT1 staining in the DG at 40x magnification from C57BL/6J LFD (A), C57BL/6J HFD (B), AβPP/PS1 LFD (C), and AβPP/PS1 HFD (D) mice. Scale bar = 50 µm. Average mean density of VGLUT1 staining in the DG (E), CA3 (F), and CA1 (G). *p<0.05, ***p<0.001 C57BL/6J LFD (n=11–13; 1–3 subjects excluded) vs C57BL/6J HFD (n=7–8; 3–4 subjects excluded); ##p<0.01, ###p<0.001 AβPP/PS1 LFD (n=6–7; 4–5 subjects excluded) vs AβPP/PS1 HFD (n=11–12; 1 subject excluded); §p<0.05, §§p<0.01 AβPP/PS1 LFD (n=6–7) vs C57BL/6J LFD (n=11–13); ‡p<0.05, ‡‡p<0.01, ‡‡‡‡p<0.0001 AβPP/PS1 HFD (n=11–12) vs C57BL/6J HFD (n=7–8); where n refers to the number of animals.
