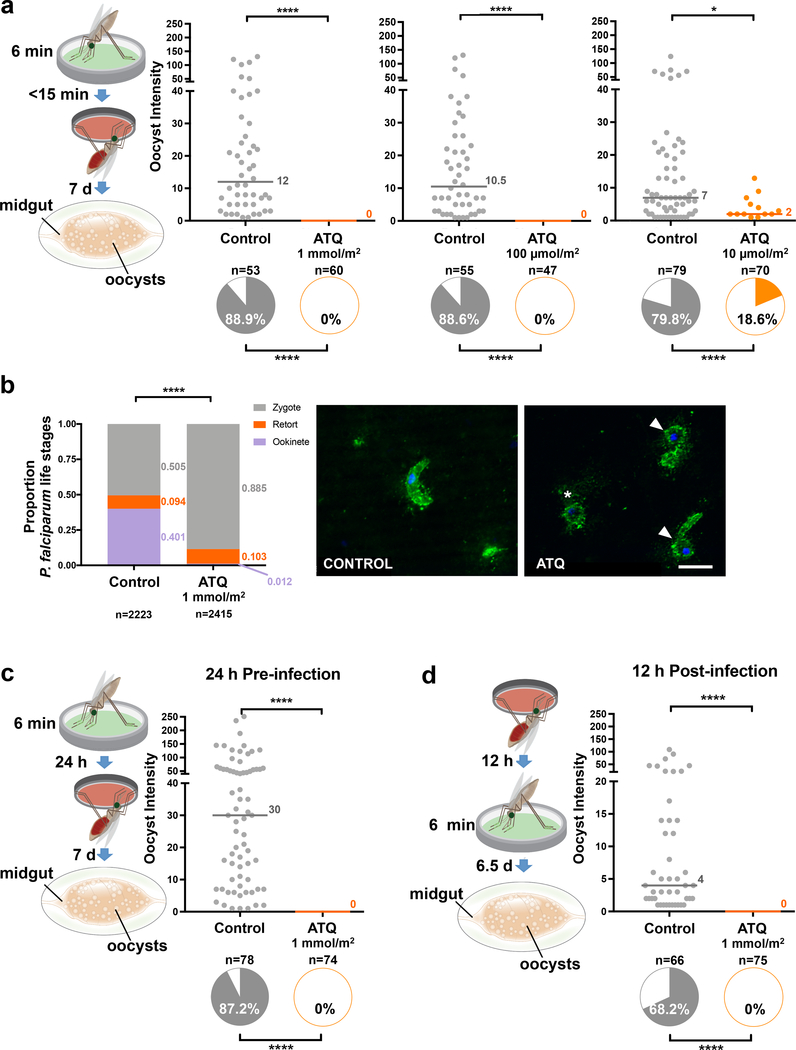
Figure 2: The transmission blocking activity of ATQ is maintained at shorter exposure times and at time points of exposure before and after infection.
(a) P. falciparum parasites are completely eliminated (0% oocyst intensity, and 0% prevalence of infection, shown in the pie charts) in females exposed to either 1 mmol/m2 or 100 μmol/m2 ATQ for 6 min (Prevalence: Two-sided Chi2. 1 mmol/m2: n = 113, df = 1, χ2 = 91.00, p < 0.0001. 100 μmol/m2: n = 102, df = 1, χ2 = 80.59, p < 0.0001). At 10 μmol/m2, prevalence of infection (10 μmol/m2: n = 149, df = 1, χ2 = 55.58, p < 0.0001) and median oocyst intensity (2-sided Mann-Whitney, n = 149, df = 1, U = 258, p = 0.0349) are significantly reduced in the ATQ-treated group. Medians are indicated. (b) IFAs of mosquito midgut lumens 21 h post P. falciparum infection using parasite-specific antibodies (anti-PfS25, green) and DNA (DAPI, blue) staining. Example images from 14 independent mosquito midgut samples (7 control, 7 ATQ-treated); P. falciparum forms are shown. Left panel: mature ookinete in controls. Right panel: zygote (asterisk) and retort forms (white arrows) in ATQ-treated females. ATQ-treated females have few ookinetes (1.2% total parasites) and a large proportion of zygotes (88.5% total parasites), indicating parasite arrest, while controls contain a significantly larger proportion of normal ookinetes (40.1%, Nominal Logistic Regression, n = 5091, df = 14, χ2 = 1620.88, p < 0.0001). Scale bar: 10 μm. (c, d) P. falciparum parasites are completely eliminated also when females are exposed to ATQ (1 mmol/m2, 6 min) either (c) 24 h prior (2-sided Chi2 w/Bonferroni correction, n= 152, df = 1, χ2 = 116.74, p < 0.0001) or (d) 12 h after (2-sided Chi2 w/ Bonferroni correction, n = 141, df = 1, χ2 = 75.11, p < 0.0001) an infectious blood meal. Medians are indicated. Where relevant, statistical significance is indicated as so: * = p < 0.05, ** = p < 0.01, *** = < 0.001, **** = p < 0.0001. For (a), (c) and (d), n indicates the number of biologically independent mosquito samples. For (b), n indicates the number of independent parasite forms.

