Figure 2.
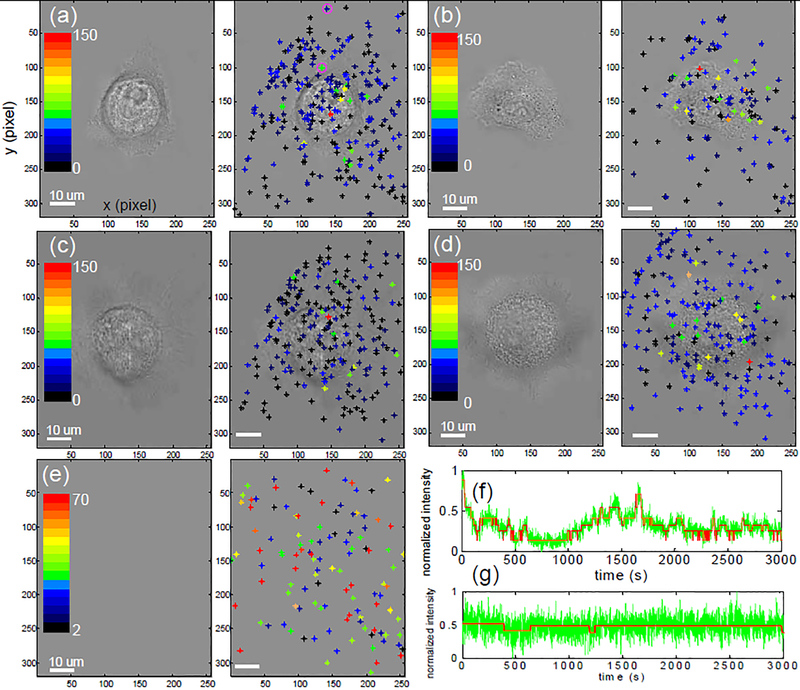
Spatial mapping of quenching transitions over single A431 cells. a-d, Quenching activity (unit of counts) over the 3000s observation window of each sensor was binned into sixteen categories represented by 16 different color bars with red having the highest quenching activity and black the lowest for live (a, b) and fixed (c, d) A431 cells. e, Control experiment where 10μM H2O2 was present in the absence of a cell. Left panels show phase contrast images without the overlap of quenching activities. Fluorescence trace of green star (f) and dark blue star (g) from (a) are shown.

