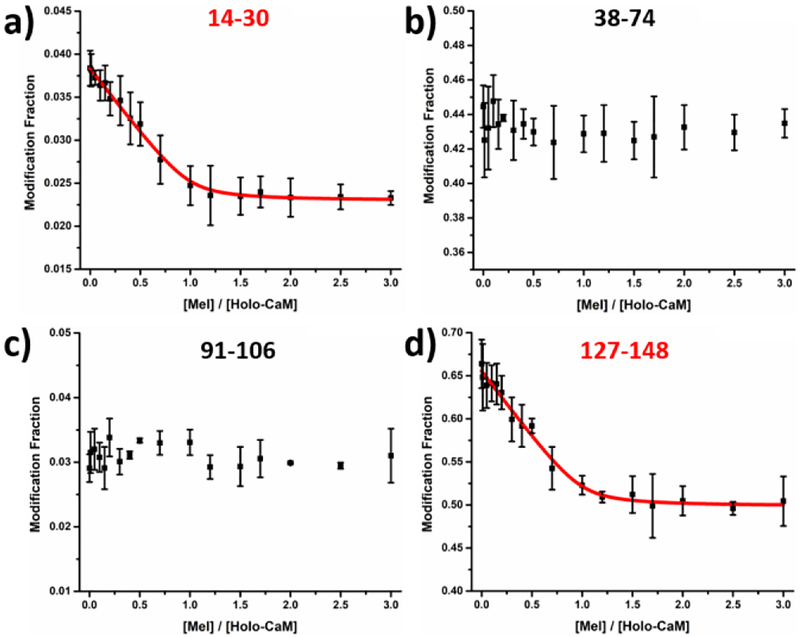
Figure 2.
Modification fraction as a function of melittin:holo-calmodulin for selected peptides. Red solid lines in (a) and (d) represents the fitting result with the algorithm described previously [14, 15]. Error bars are standard deviations from two independent runs whereas the data points represent the average of two runs. Response curves for the remaining

