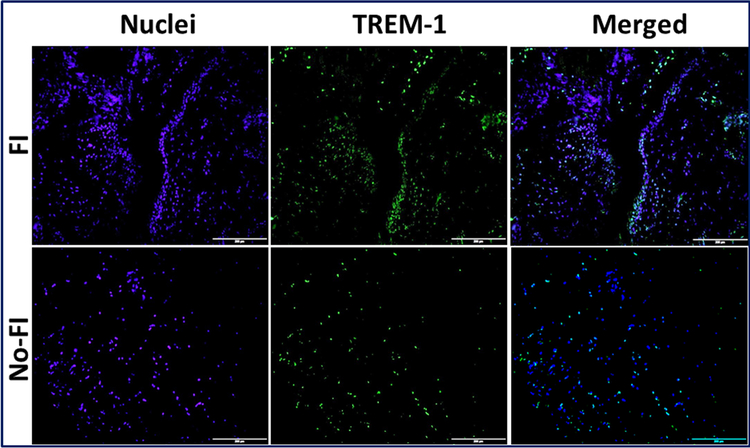
Figure 2:
Immunofluorescence analysis for the expression of TREM-1 showing increased expression in FI group compared to the No-FI group. Figure represents similar expression pattern in all 4 patients from each group. Images in the top row are histological sections of patient biopsies from the FI group, and images in the bottom row are histological sections of patient biopsies from the No-FI group. Images in the left column show nuclear staining with DAPI; the images in the middle column show expression of AMPK while the images in the right column show overlay of AMPK staining with DAPI. Images were acquired at 20x magnification using CCD camera attached to the Olympus microscope.

