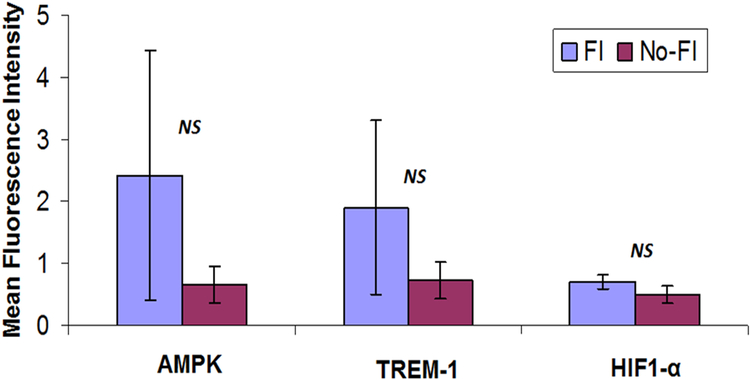
Figure 4:
The image shows quantification of gene expression in Figures 1, 2, and 3. The intensity of gene expression as observed through immunofluorescence was acquired and the mean fluorescence intensity (MFI) was quantified from five randomly selected independent fields. The graphs represent MFI mean values with standard error.

