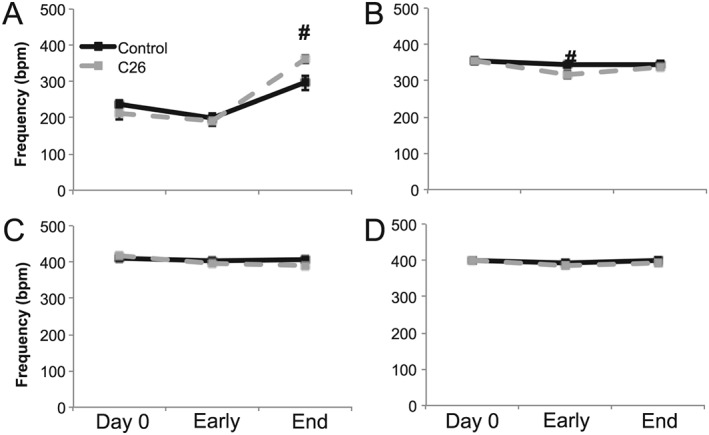
Figure 2.

Plethysmography frequency measurements. Breathing frequency during (A) air, (B) hypoxia, (C) hypercapnia, and (D) maximum respiratory challenges at day 0, early disease (day 14), and end‐stage disease (day 25) time points of control (black solid) and C26 (grey dash) mice. # denotes significant difference between control and C26 mice (P < 0.05).
