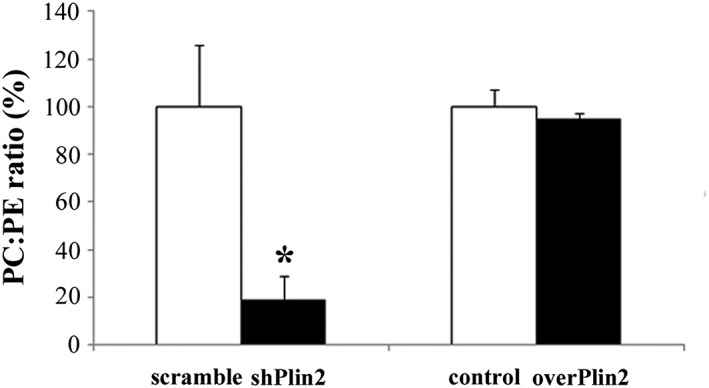
Figure 4.

Phosphatidylcholine (PC) and phosphatidylethanolamine (PE) ratio in tibialis anterior muscle after Plin2 modulation. Left columns: shPlin2 muscles compared with scramble (n = 6 mice per group), * P = 0.001. Right columns: overPlin2 muscles compared with controls (n = 6 per group). Data are shown as mean ± SEM. P values refer to two‐tailed Student's t‐test.
