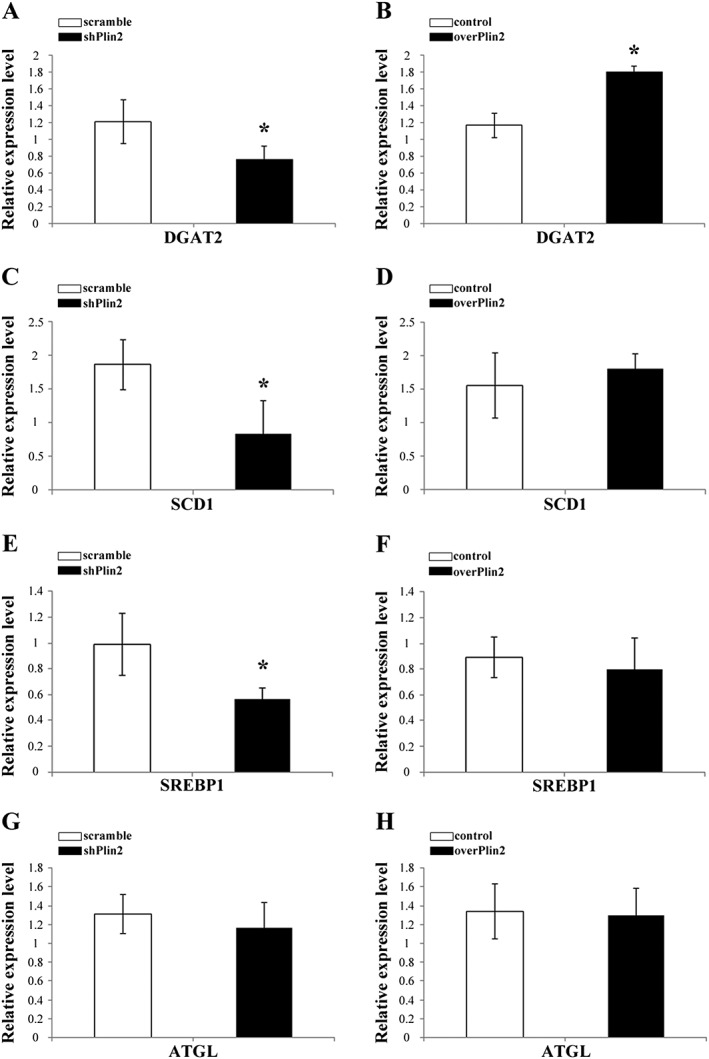
Figure 5.

Relative expression of relevant genes involved in lipid metabolism in tibialis muscle after Plin2 modulation. (A, C, E, and G) Plin2 down‐regulation. (B, D, F, and H) Plin2 overexpression. (A and B) DAG acyltransferase 2 (DGAT2). (C and D) Stearoyl CoA desaturase 1 (SCD1). (E and F) Sterol regulatory element‐binding protein 1 (SREBP1). (G and H) Adipose triglyceride lipase (ATGL). Results were normalized to GAPDH RNA expression. Data refer to six samples for each group. Data are shown as mean ± SEM. * P < 0.02, two‐tailed Student's t‐test.
