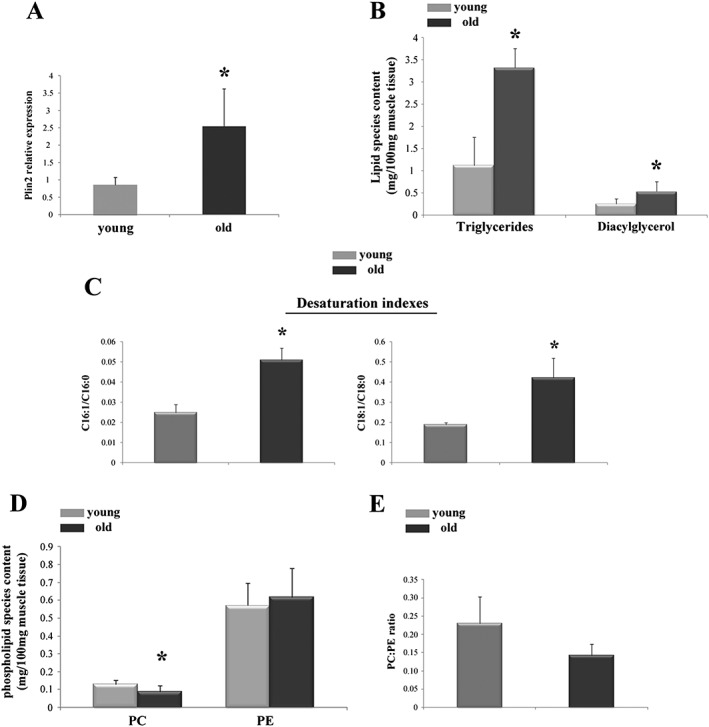
Figure 7.

Plin2 expression and lipid content and composition in vastus lateralis muscle of young and old patients. (A) Relative expression level of Plin2, * P = 0.001. (B) Total triglycerides (TAG) and diacylglycerols (DAG), * P = 0.04 and * P = 0.002, respectively. (C) Desaturation indexes of C16:1/C16:0 and C18:1/C18:0, * P = 0.02 and * P = 0.03, respectively. (D) Phosphatidylcholine (PC), * P = 0.04, and phosphatidylethanolamine (PE) content. (E) PC/PE ratio. Data refer to 10 samples for young group and 9 samples for old group. Data are shown as mean ± SEM. P values refer to two‐tailed Student's t‐test.
