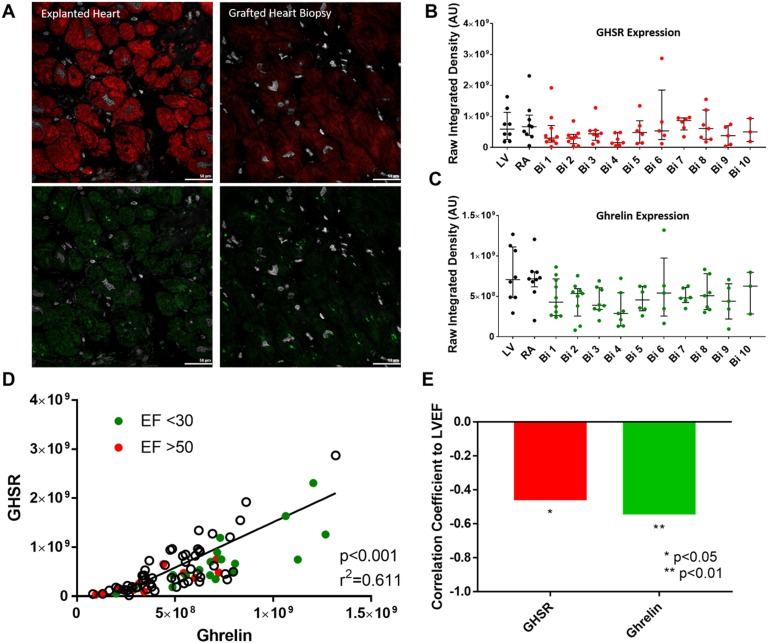
Figure 1.
Ghrelin and GHSR expression in patients pre- and postcardiac transplant. (A) Representative fluorescent images of GHSR (red), ghrelin (green), and DAPI (white) are shown in explanted heart tissue (left) and grafted heart biopsies (right) taken from the same patient. (B and C) Quantified fluorescence intensity of GHSR (red) and ghrelin (green) from explanted heart tissue (LV and RA, black dots) and grafted heart biopsies (Bi 1-10, colored dots). (D) Positive correlation of GHSR and ghrelin expression is shown in the entire cardiac transplant cohort with EF <30 in green and EF >50 in red, with white dots representing tissue samples without related EF values. Each dot represents one transplant patient sample. (E) Negative correlation between LVEF and GHSR (red) and ghrelin (green). AU, arbitrary unit; Bi, biopsy.

