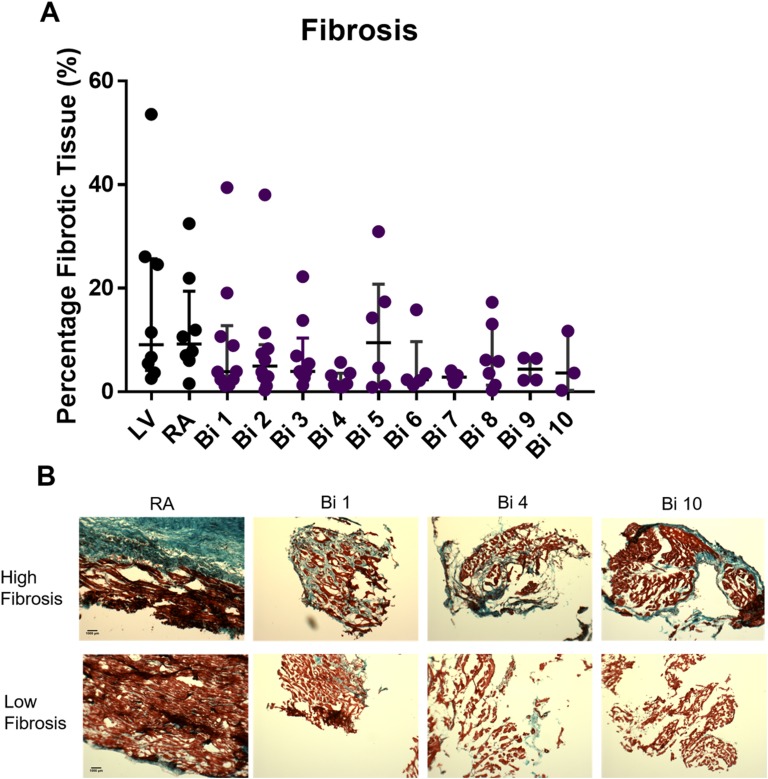
Figure 4.
Cardiac fibrosis in patients pre- and postcardiac transplant. (A) Quantified fibrotic data are shown for explanted heart tissue (LV and RA, black dots) and grafted heart biopsies (Bi 1-10, colored dots). (B) Representative images of the fibrotic variability between patients showing high levels of fibrosis (top) and low levels of fibrosis (bottom) where blue is fibrotic tissue (collagen I and III) and red is healthy cardiac tissue. Images of the RA, Bi 1, Bi 4, and Bi 10 showing different patients at same time point pre- and postcardiac transplant.

