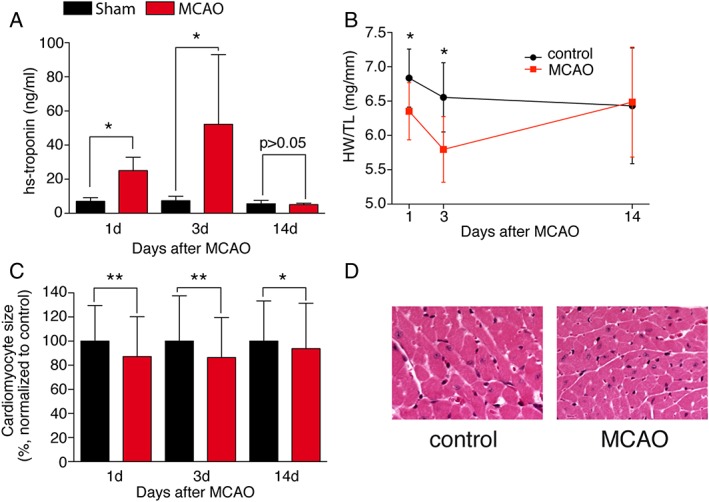
Figure 2.

Cardiac atrophy as a consequence of ischaemic stroke. (A) Measurement of high‐sensitive troponin T in the serum of mice after sham and middle cerebral artery occlusion (MCAO) 60 min at 1, 3, and 14 days (n = 5–6/group). (B) Heart weight/tibia length ratio (WT/TL) 1, 3, and 14 days after stroke (n = 6–13/group). (C) Cardiomyocyte cross‐sectional area measured at 1, 3, and 14 days (n = 233–329/group, N > 3/group). Representative haematoxylin and eosin images of the hearts 1 day after stroke (×40). (D) Representative haematoxylin and eosin images of the hearts 1 day after stroke (×40). All results are shown as mean ± standard deviation. * P < 0.05 sham vs. MCAO.
