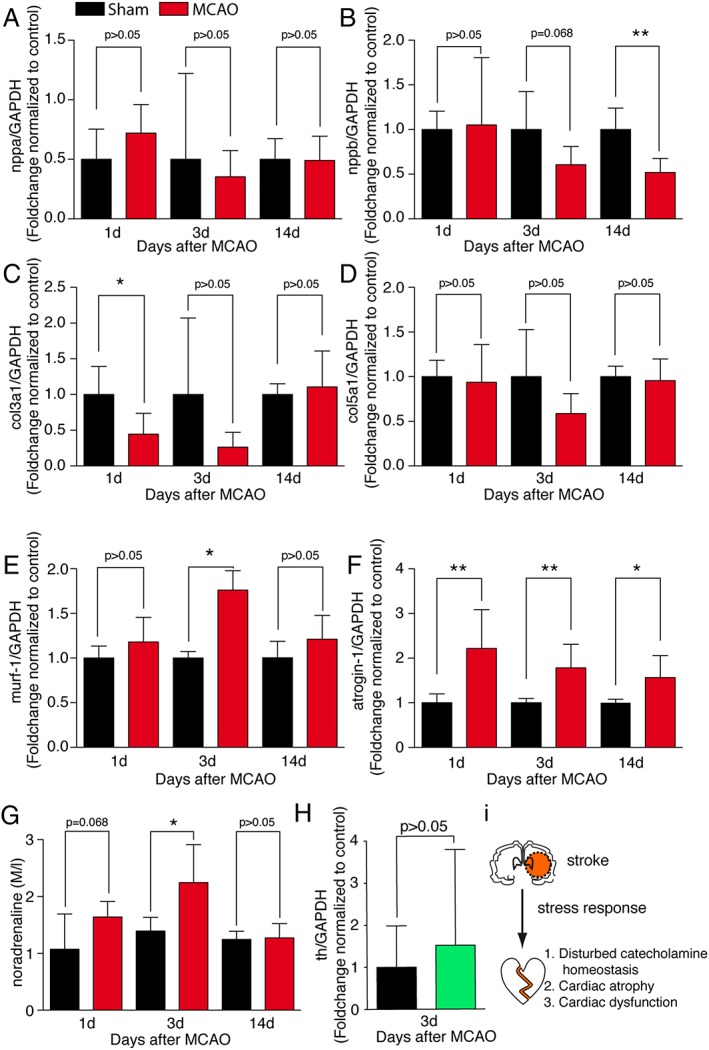
Figure 3.

Transcriptional consequences. Transcript levels of (A) nppa, (B) nppb, (C) col3a1, (D) col5a1, (E) murf‐1, and (F) atrogin‐1 in the hearts from sham‐operated control animals and 60 min middle cerebral artery occlusion (MCAO) animals as indicated, normalized to control (n = 5–6/group) at time points 1, 3, and 14 days after 60 min MCAO and sham operation. (G) Tissue noradrenaline concentration in the hearts of sham‐operated and 60 min MCAO mice, respectively (n = 6/group). (H) Transcript levels of tyrosinhydroxylase (th) in cardiac ganglia from sham‐operated and MCAO‐operated animals, 3 days after intervention (n = 6–7/group). All results are shown as mean ± standard deviation. * P < 0.05 sham vs. MCAO. (I) Working model.
