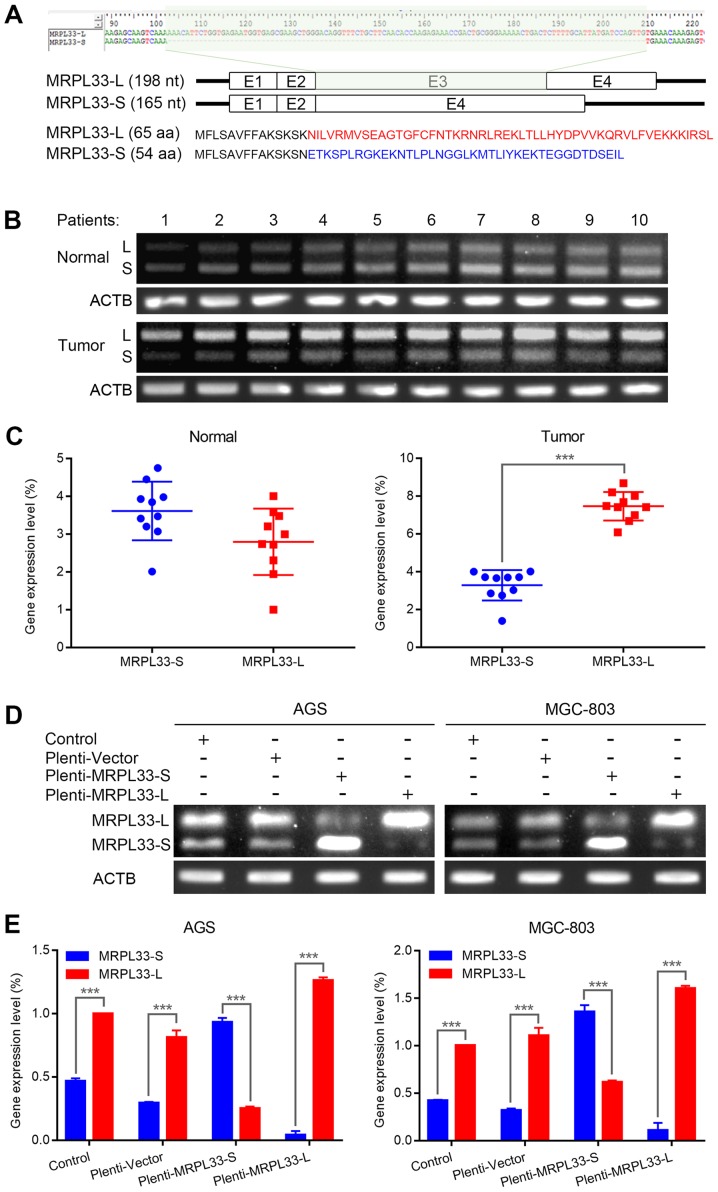
Figure 1.
Expression of MRPL33-L and MRPL33-S in gastric cancer. (A) Schematic diagram of the splice variants of MRPL33, including or lacking alternative exon 3 (MRPL33-L and MRPL33-S; top). Different amino acid sequences are presented in red font for of MRPL33-L and in blue font for MRPL33-S (bottom). (B) Agarose gel electrophoresis photograph and (C) corresponding scatter diagrams of expression levels of MRPL33-L and MRPL33-S in 10 paired clinical specimens of tumor and matched adjacent normal tissues from patients with gastric cancer. (D) Agarose gel electrophoresis photograph and (E) corresponding histograms of expression levels of MRPL33-L and MRPL33-S in AGS and MGC-803 cells. Three independent biological replicates were performed and data were presented as the mean ± standard deviation. ***P<0.001 with comparisons shown by brackets. MRPL33, mitochondrial ribosomal protein L33; L, long variant; S, short variant; ACTB, actin β.

