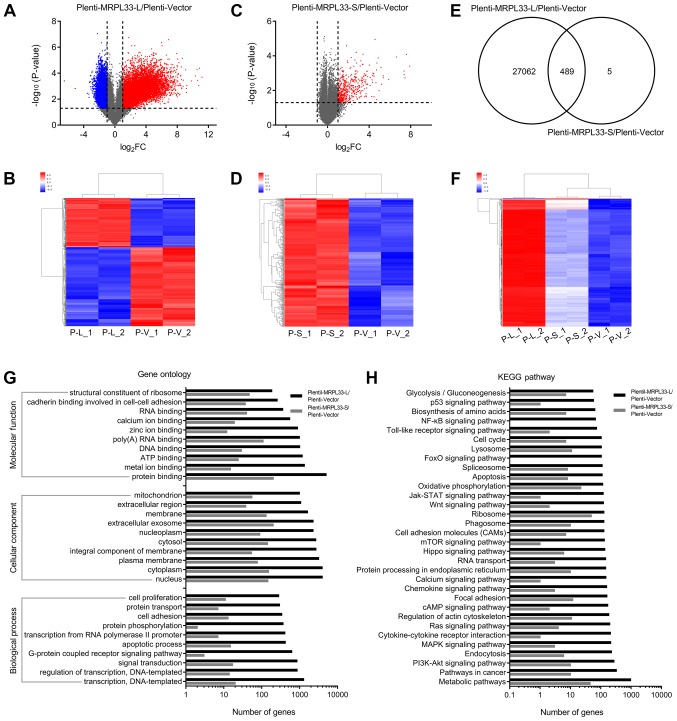
Figure 3.
Effects of MRPL33-L and MRPL33-S overexpression in AGS gastric cancer cells. (A) Volcano plot and (B) heatmap indicating upregu-lated and downregulated genes in plenti-MRPL33-L-transfected cells. (C) Volcano plot and (D) heatmap indicating upregulated and downregulated genes in plenti-MRPL33-S-transfected cells. (E) Venn diagram and (F) heatmap showing the number of overlapping DEGs in plenti-MRPL33-L and plenti-MRPL33-S-transfected cells. (G) Gene Ontology analysis of DEGs in plenti-MRPL33-L and plenti-MRPL33-S-transfected cells. (H) KEGG pathway analysis of DEGs in plenti-MRPL33-L and plenti-MRPL33-S-transfected cells. MRPL33, mitochondrial ribosomal protein L33; L, long variant; S, short variant; DEGs, differentially expressed genes; KEGG, Kyoto Encyclopedia of Genes and Genomes.

