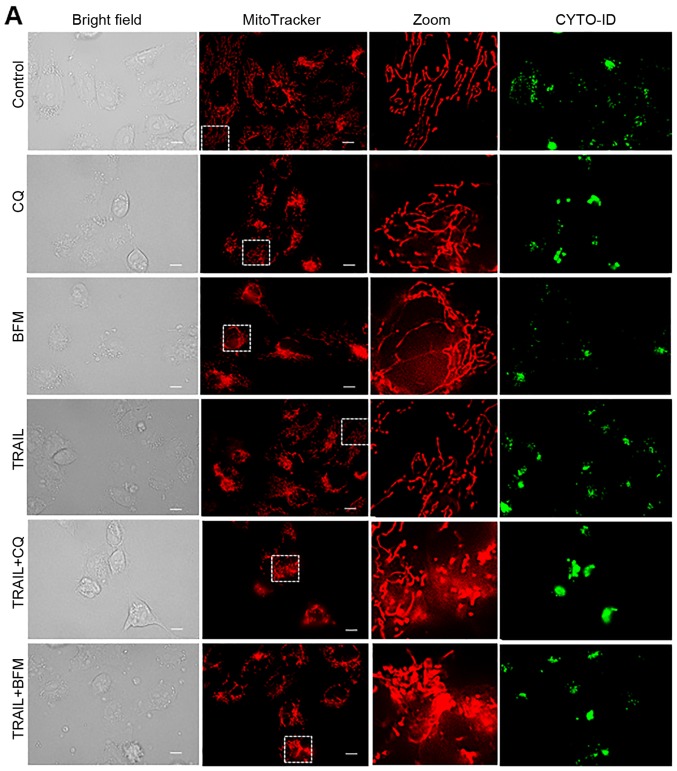
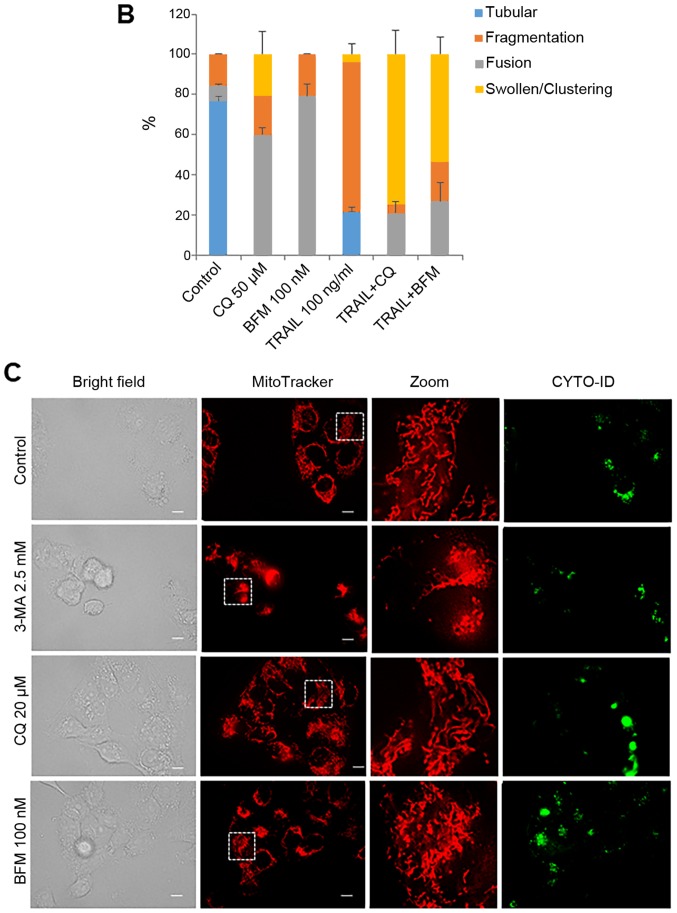
Figure 5.
Different autophagy inhibitors disrupt the mitochondrial network cooperatively with TRAIL. (A) HOS cells cultured on the imaging chamber was treated with the agents at the indicated concentrations alone or in combination for 24 h at 37°C. The cells were stained with CYTO-ID and MitoTracker Red CMXRos for 1 h and washed again. Images were obtained using a fluorescence microscope. The zoom panels represent the expansion of the small white boxes within MitoTracker images. Scale bar, 10 µm. (C) A2058 cells cultured on the imaging chamber was treated with the agents at the indicated concentrations alone or in combination for 24 h at 37°C. The graph in (B) shows the percentages of mitochondria with four different types of morphology, i.e., tubular, fission, fragmentation, and swelling and clustering in each sample. TRAIL, tumor necrosis factor-related apoptosis-inducing ligand; CQ, chloroquine; BFM, bafilomycin A1.


