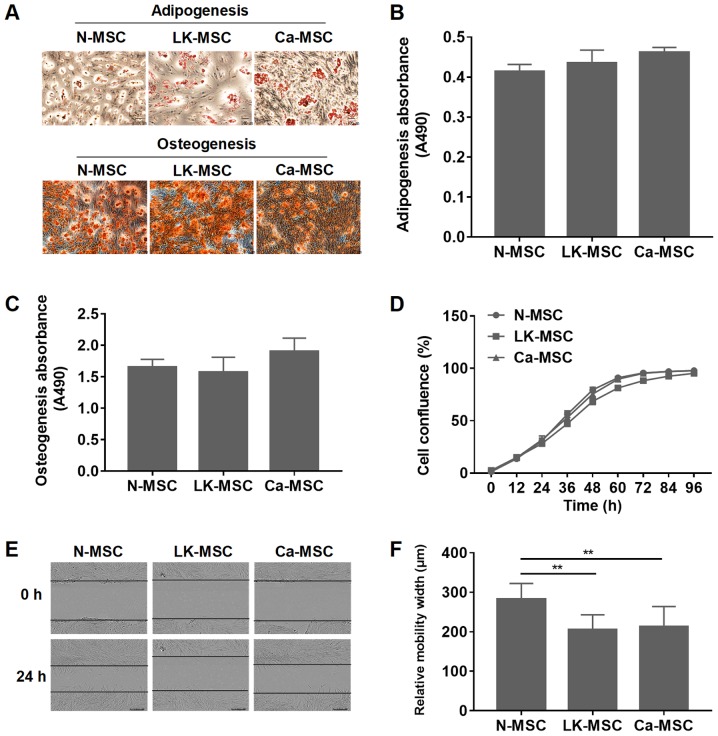
Figure 1.
Characteristics of the N-MSCs, LK-MSCs and Ca-MSCs. (A) Adipogenic and osteogenic differentiation were assessed. Representative images with a magnification of ×10 are depicted. (B) Quantitative analysis of adipogenic differentiation was calculated using the absorbance value at 490 nm. (C) Quantitative analysis of osteogenic differentiation was calculated using the absorbance value at 490 nm. (D) MSCs were cultured and the cell confluence was analyzed with an InCucyte monitoring microscope. (E and F) The relative migration width was determined by a wound healing assay. Representative images with a magnification of ×10 are depicted. **P<0.01. MSC, mesenchymal stem cell; N-MSC, MSCs derived from normal oral mucosa; LK-MSC, MSCs derived from oral leukoplakia with dysplasia; Ca-MSC, MSCs derived from oral carcinoma.

