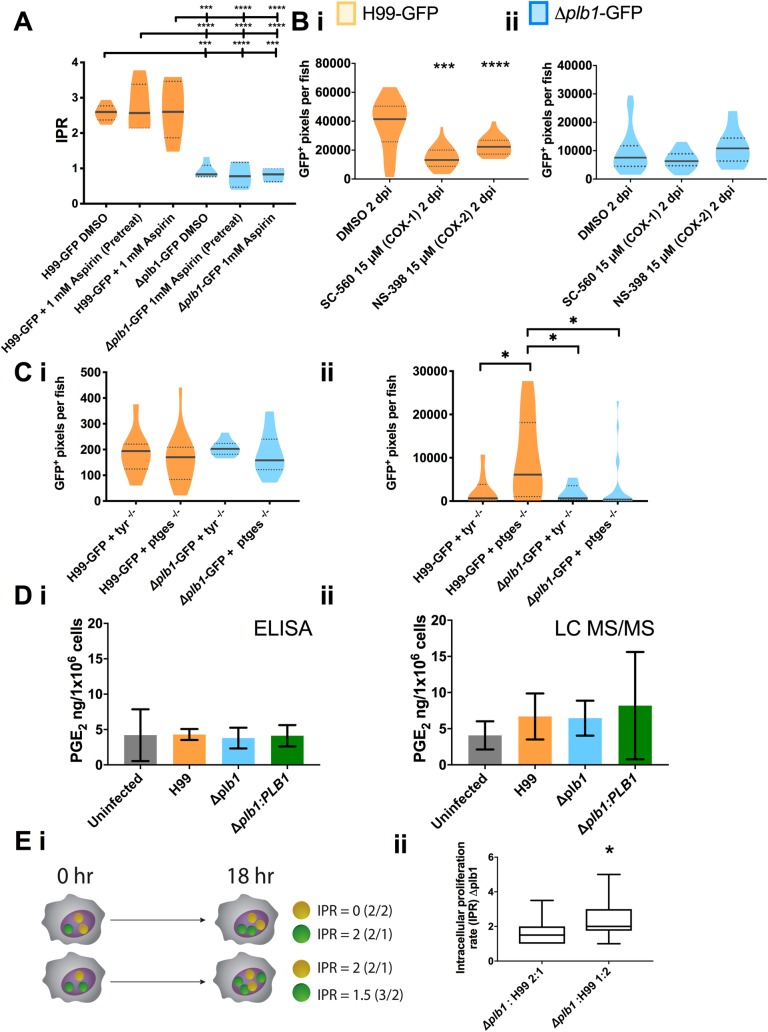
Fig 4. Host derived prostaglandins are not required for growth of C. neoformans.
A Intracellular proliferation quantified from timelaspe movies of J774 macrophages infected with H99-GFP or Δplb1-GFP and treated with 1 mM Aspirin–either for 18 hours before infection (pretreatment) or throughout the time course of infection. One-way ANOVA with Tukey post-test performed comparing all conditions. H99-GFP DMSO vs. Δplb1-GFP DMSO *** p = 0.0002. H99-GFP DMSO vs. Δplb1-GFP 1 mM (pretreat) **** p = <0.0001. H99-GFP DMSO vs. Δplb1-GFP 1 mM aspirin *** p = 0.0001. H99-GFP + 1mM aspirin (pretreat) vs. Δplb1-GFP DMSO **** p <0.0001. H99-GFP + 1mM aspirin (pretreat) vs. Δplb1-GFP 1 mM aspirin (pretreat) **** p < 0.0001. H99-GFP + 1mM aspirin (pretreat) vs. Δplb1-GFP 1 mM aspirin **** p <0.0001. H99-GFP+ 1mM aspirin vs. Δplb1-GFP DMSO *** p = 0.0001. H99-GFP + 1mM aspirin vs. Δplb1-GFP 1 mM aspirin (pretreat) **** p <0.0001. H99-GFP+ 1mM aspirin vs. Δplb1-GFP 1 mM aspirin **** p < 0.0001. B i H99-GFP infected larvae treated with 15 μM NS-398, 15 μM SC-560 or equivalent solvent (DMSO) control. Box and whiskers show median, 5th percentile and 95th percentile. At least 25 larvae measured per treatment group from 2 biological repeats. Mann-Whitney U test used to compare between treatments, DMSO vs. 15 μM *** p = 0.0002. B ii Δplb1-GFP infected larvae treated with 15 μM NS-398, 15 μM SC-560 or equivalent solvent (DMSO) control. Box and whiskers show median, 5th percentile and 95th percentile. At least 34 larvae measured per treatment group from 2 biological repeats. Mann-Whitney U test used to compare between treatments, no significance found. C 2 dpi zebrafish larvae crispants with CRISPR knockout against Prostaglandin E2 synthase (ptges) or a Tyrosinase control (tyr) infected with H99-GFP or Δplb1-GFP, fungal burden quantified at 0 dpi (C i) and 3 dpi (C ii)–data shown is a single experiment but is representative of N = 3 experiments. One way ANOVA with Tukey post-test performed to compare each condition C i no significance found C ii H99-GFP + tyr -/- vs. H99-GFP + ptges -/- * p = 0.0390. H99-GFP + ptges -/- vs. Δplb1-GFP + tyr -/- * p = 0.0313. H99-GFP + ptges -/- vs. Δplb1-GFP + ptges -/- * p = 0.0121. D i PGE2 monoclonal EIA ELISA performed on supernatants from C. neoformans infected macrophages collected at 18 hr post infection. Mean concentration of PGE2 (pg per 1x10⁶ cells) plotted with SD, n = 4. One-way ANOVA with Tukey post-test performed, no significance found. D ii LC MS/MS mass spectrometry analysis performed on cell suspensions (infected J774 cells and supernatants) collected at 18 hr post infection. Mean concentration of PGE2 (pg per 1x10⁶ cells) plotted with SD, n = 3. One-way ANOVA with Tukey post-test performed, no significance found. E J774 cells co-infected with a 50:50 mix of Δplb1 and H99-GFP. i Diagrammatic representation of co-infection experiment. GFP+ (green) and GFP- (yellow) C. neoformans cells within the phagosome were quantified at 0 hr, macrophages with a burden ratio of 1:2 or 2:1 were re-analysed at 18 hr, the IPR for Δplb1 within 2:1 and 1:2 co-infected cells were calculated by dividing the burden at 18hr by burden at 0 hr for GFP+ (green) or GFP- (yellow) cells. ii Quantification of IPR for Δplb1 cells within Δplb1:H99-GFP 2:1 or 1:2 co-infected macrophages. At least 35 co-infected macrophages were analysed for each condition over 4 experimental repeats. Student’s T test performed to compare ratios– 2:1 vs 1:2 * p = 0.0137.

