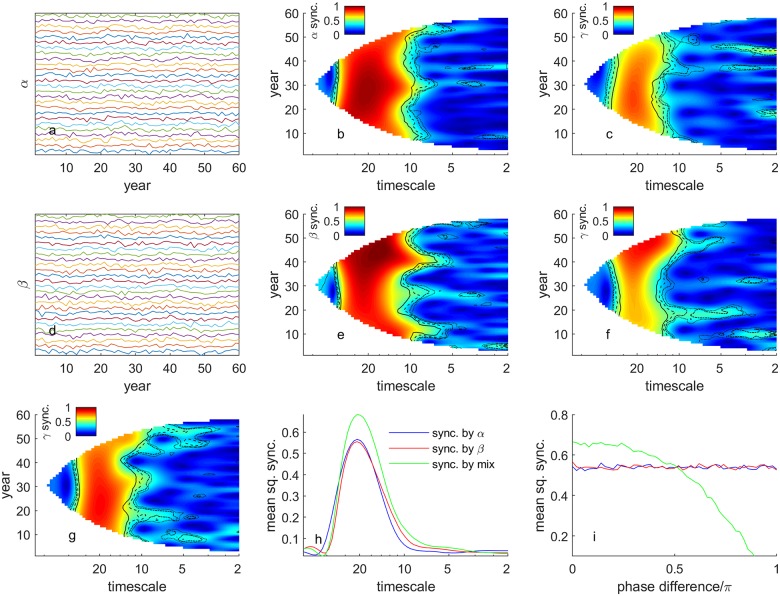
Fig 1. Synthetic example showing the effects of two different synchronizing factors, individually and in interactive combination.
Panel (a) shows fluctuations in 26 signals α(n, t) with a synchronous 20-year-period sine wave component obscured by independent local noise. Panel (d) shows 26 signals β(n, t) with a synchronous 20-year-period cosine component, also obscured by independent local noise of the same strength. Panels (b) and (e), which are wavelet mean field magnitudes (WMFM; Methods) of (a) and (d), respectively, display synchrony as a function of time and timescale and reveal synchrony at timescale 20 years. Panels (c) and (f) show WMFMs of populations influenced by α and β, respectively, and also by independent local noise time series of the same strength. β acts with a 5-year lag, 1/4 of the underlying 20-year periodicity. Synchrony is still visible, and is similar in strength, but is muted relative to (b) and (e) by the additional local noise acting on the populations. Panel (g) shows the WMFM of populations subject to a mixed influence of α and β, normalized so this influence had the same variance through time as the influences α and β had individually for panels (c) and (f). Independent local noise of the same strength was again applied. Synchrony is stronger in (g) than in (c) and (f), demonstrating interaction effects of the synchronizing agents α and β. Panel (h) shows the time-averaged square of the WMFM of (g), in green (called the mean squared WMFM or mean squared synchrony in Methods), which is greater than that of (c), in blue, or (f), in red. Panel (i) shows how interaction effects are a result of the phase relationships between the drivers. As the phase of the co-sinusoids underlying β are modified in further simulations, the interaction effect goes from positive to negative as the phase shift passes 0.5π. Significance contours on Fig.1b,c,e,f,g represent wavelet phasor mean field magnitude (Methods; WPMFM) significance thresholds at the 0.1, 0.05, 0.01, and 0.001 levels, respectively for the dot, dot-dash, dash and line contours. These significance thresholds are relative to a null hypothesis of no association between the phases of the 26 transforms. See text for mathematical details. WMFMs are not guaranteed to be ≤ 1 at all times, but ours were except for (e), which had maximum squared value 1.0111. For clearer plotting, we reassigned values > 1 in (e) to 1. Sync. = synchrony.

