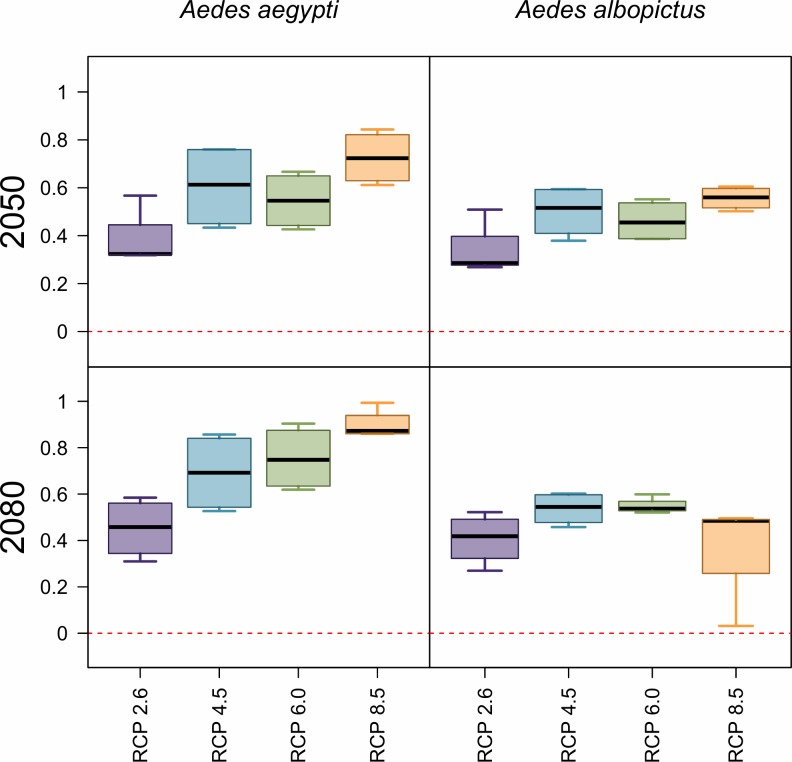
Fig 3. Projected net changes in population at risk.
Projections are given as the net difference in billions at risk, for Ae. aegypti and Ae. albopictus transmission, between current maps and 2050 (top row) or 2080 (bottom row). Results are further broken down by representative climate pathways (RCPs), each averaged across 4 general circulation models.

