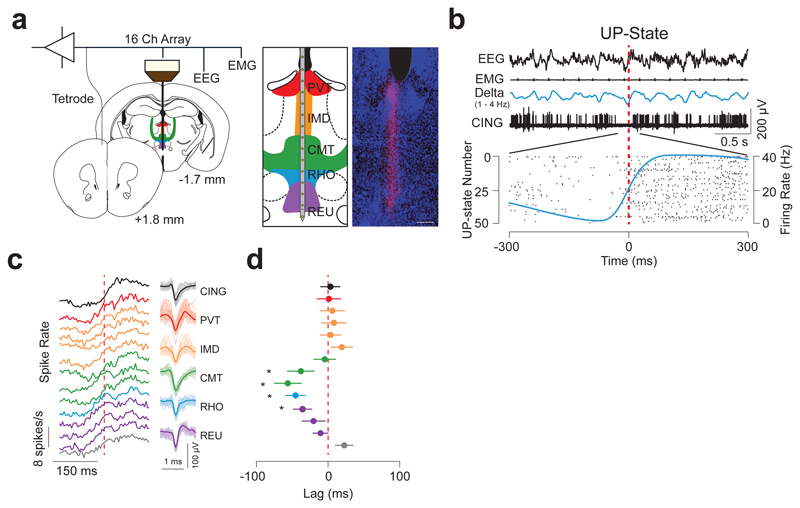
Figure 1. CMT neuron spiking is phase-advanced to cortical UP-states.
a, Schematic of instrumentation (left) for chronic recording from 16-channel linear array electrode in the midline thalamus and tetrode in CING in freely-moving mice. Illustration (middle) and anatomical verification (right) of the electrode array placement across the midline thalamic nuclei are shown. Scale bar: 150 µm. b, Representative EEG, EMG, LFPs and neuron unit recordings in CING during NREM sleep. Onset of the cortical UP-state is shown by the vertical dashed line (red) which corresponds to the detection of UP-states from the EEG based on zero-crossing (see Methods). Raster plot shows spiking activity from a representative CING neuron at the onset of 50 successively detected UP-states (bottom) recorded during spontaneous NREM. Average neuronal firing rate for the neuron (based on 10 ms bins) is shown by the blue solid line. Note the sigmoidal shape. c, Averaged spiking rate traces for each recording site (n = 13, 8, 8, 6, 6, 8, 7, 7, 8, 7, 7, 8, 8, 7 cells from top to bottom; during 28390 UP-states, from n = 6 animals) at the onset of the UP-state (dashed red line) during spontaneous NREM sleep. The grey plot indicates neurons recorded ventral to the midline thalamus. Representative spike waveforms for each nucleus are shown on the right. d, Averaged lags ± S.E.M. of half times from sigmoidal fits of spiking rates at the onset of cortical UP-state. Note the CMT neuron spike rate advancement over other thalamic and neocortical neurons. (CMT vs reuniens, rhomboideus, intermediodorsal, and paraventricular, P = 0.0073; f = 4.422; d.f. = 4; n = 22, 23, 7, 28 and 8 cells, respectively, n = 6 animals; one-way ANOVA;).

