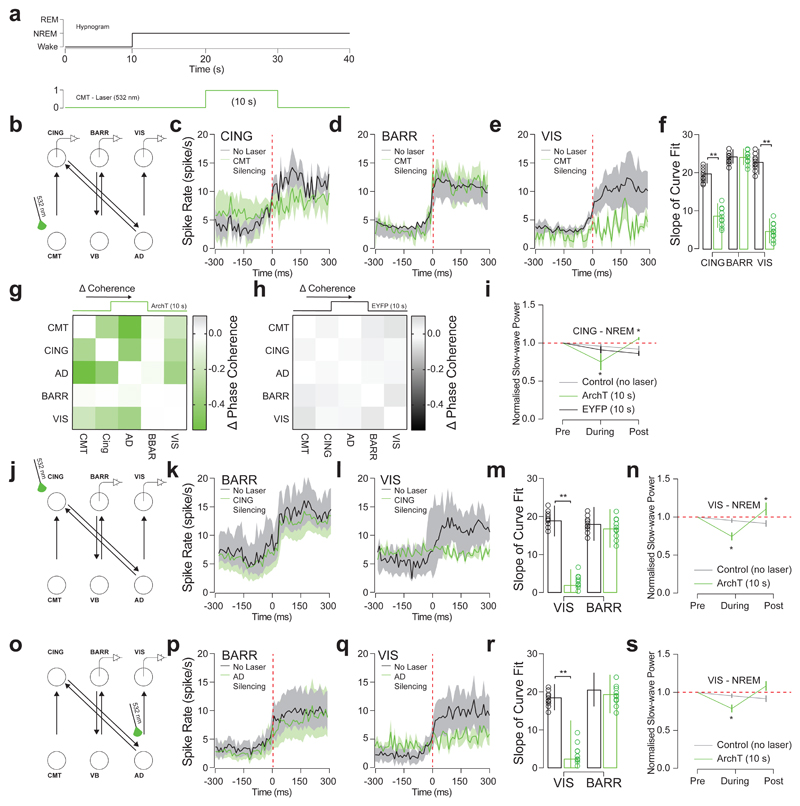
Figure 5. CMT neuron firing is necessary for cortical UP-state synchrony.
a, Experimental timeline showing optical silencing (10 s, 532 nm) of ArchT-expressing CMT neurons 10 s after the onset of NREM. b, Schematic of N-type circuit and instrumentation for chronic implantation of multi-site tetrode recordings from CING, BARR and VIS and optic fiber implants over CMT. AAV2-CamKII-ArchT-EYFP was stereotactically injected into CMT. c, d, e, Average spiking rates ± S.E.M. for CING (c; n = 9 cells), BARR (d; n = 6 cells) and VIS (e; n = 8 cells; from n = 6 animals) neurons at the onset of the cortical UP-states (red dashed line). Note that silencing of EYFP-expressing CMT neurons (control) did not significantly change spiking rates in CING (P = 0.44; t = 1.74; d.f. = 16; n = 9 cells; n = 6 animals; two-sided t-test). f, Average slope ± S.E.M. of curve fits for spiking rates at the start cortical UP-state. (CING: P = 0.008; t = 2.66; d.f. = 16; n = 9 cells; BARR: P = 0.96; t = 0.05, d.f. = 10; n = 6 cells; VIS: P = 0.002; t = 3.87; d.f. = 14; n = 8 cells; from n = 6 animals; two-sided t-test). g, h, Averaged change in phase coherence for CMT, CING, AD, BARR and VIS for optical silencing of CMT neurons expressing ArchT-EYFP (g) and EYFP (h). i, Averaged delta power ± S.E.M. of LFP signals recorded in CING 10 s before, during and 10 s after optogenetic silencing of ArchT-(green) or EYFP-(black) expressing CMT neurons compared to control conditions (grey). Delta power is normalized to the first 10 s of NREM. Note the rebound in delta activity after CMT neuron silencing (dotted red line). (P = 0.005; two-sided t-test; t = 5.02; d.f. = 5; n = 6; animals compared to normalized value 1). j, Schematic of N-type circuit and instrumentation for chronic implantation of multi-site tetrode recordings from BARR and VIS and optic fiber implants over CING. AAV2-CamKII-ArchT-EYFP was stereotactically injected into CING. k, l, Average spiking rates ± S.E.M. for BARR (k; n = 6 cells) and VIS (l; n = 6 cells; from n = 5 animals) neurons at the onset of the cortical UP-states (red dashed line). m, Average slope ± S.E.M. of curve fits for spiking rates at the start cortical UP-state. (BARR: P = 0.86; t = 1.02; VIS: P = 0.014; t = 3.99; d.f. = 4; two-sided t-test;). n, Averaged delta power ± S.E.M. in VIS 10 s before, during and 10 s after optogenetic silencing of ArchT-expressing CING neurons (green; P = 0.036; one-sided t-test; t = 3.99; d.f. = 3; one-sided t-test; from n = 5 animals) and control conditions (grey). Delta power is normalized to the first 10 s of NREM. Note the rebound in delta activity after CMT neuron silencing (dotted red line; P = 0.039; one-sided t-test; t = 3.45; d.f. = 3; one-sided t-test; compared to normalized value 1). o, Schematic of N-type circuit and instrumentation for chronic implantation of multi-site tetrode recordings from BARR and VIS and optic fiber implants over AD. AAV2-CamKII-ArchT-EYFP was stereotactically injected into AD. p, q, Average spiking rates ± S.E.M. for BARR (p; n = 9 cells) and VIS (q; n = 10 cells; from n = 6 animals) neurons at the onset of the cortical UP-states (red dashed line). r, Average slope ± S.E.M. of curve fits for spiking rates at the start cortical UP-state. BARR: P = 0.75; t = 1.73; d.f. = 7; n = 9 cells; VIS: P = 0.036; t = 6.84, d.f. = 8; n = 10 cells; n = 6 animals; two-sided t-test). s, Averaged delta power ± S.E.M. in VIS 10 s before, during and 10 s after optogenetic silencing of ArchT-expressing AD neurons (green) and control conditions (grey). Delta power is normalized to the first 10 s of NREM. Note the rebound in delta activity after CMT neuron silencing (dotted red line; P = 0.011; t = 4.63; d.f. = 4; from n = 6 animals; one-sided t-test; compared to normalized value 1).

