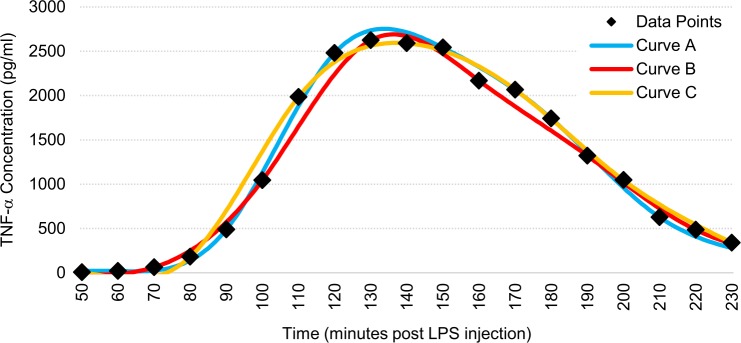
Fig 3. Representative figure demonstrating the effectiveness of our curve-fitting method on a TNF-α cytokine cascade.
Data points were taken every 10 minutes. Curve A utilized only points at 60, 90, 120, 150, 180, and 210 minutes. Curve B utilized only points at 70, 100, 130, 160, 190, and 220 minutes. Curve C utilized only points at 50, 80, 110, 140, 170, 200, and 230 minutes.

