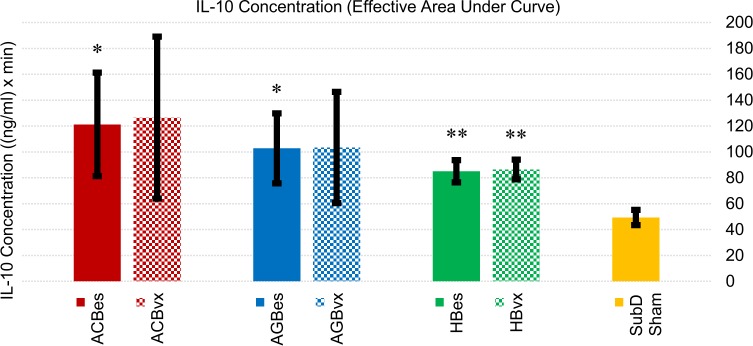
Fig 7. Cumulative IL-10 concentration effects of subgroup responses to IP injection of LPS (5 mg/kg).
Values represent effective areas under the curve for each subgroup shown in Fig 6. Error bars, s.e.m. *p < 0.05 compared to SubD Sham group. **p < 0.01 compared to SubD Sham group.

