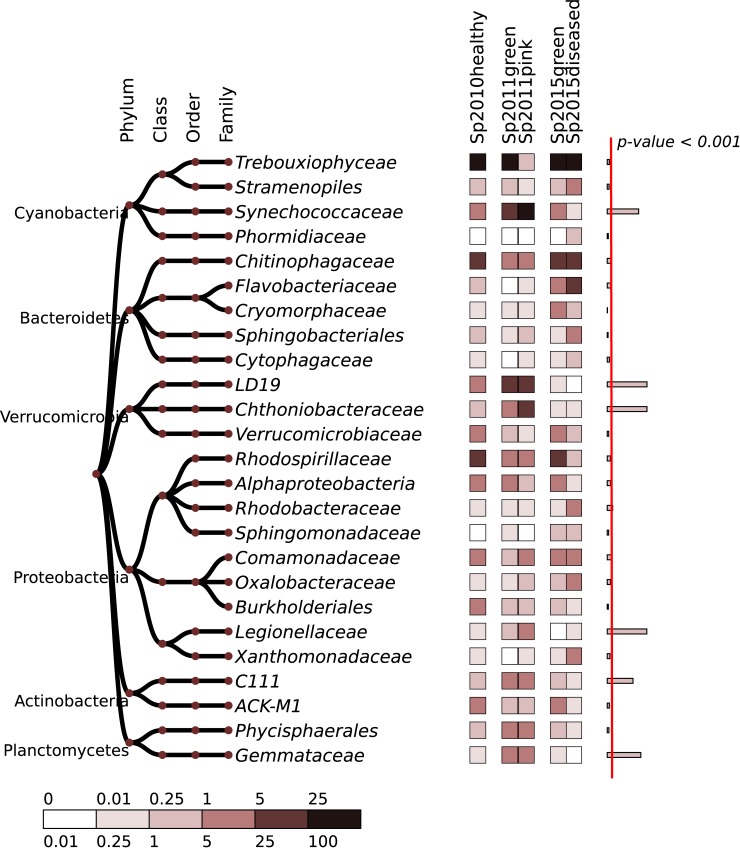
Fig 3. Heatmap of 25 most abundant bacterial families.
The relative abundances for individual 2015 samples are averaged. The abundance values were transformed by the quantile normalization, to reduce the biases introduced by sequencing technology. The right column shows a significance of variation between groups, estimated using ANOVA test; width of the bars corresponds to–ln (p-value). Red line separates the significance level of 0.999 (p-value < 0.001).

