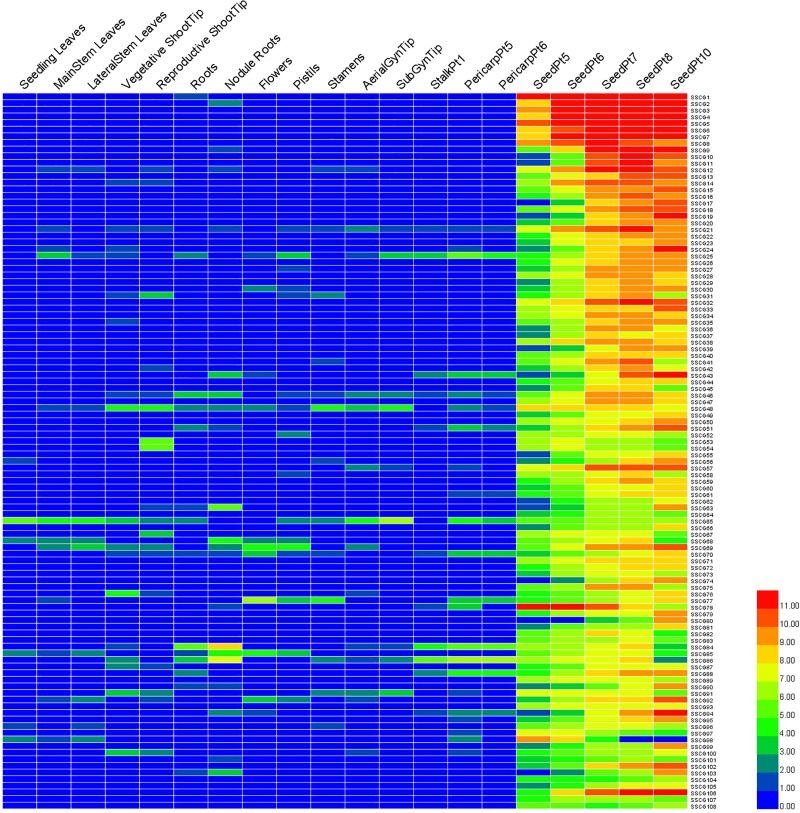
Fig 2. Expression profiles of the top 108 SSCGs in 20 different tissues of A. duranensis and A. ipaensis.
The FPKM data of 20 distinct tissues for the top 108 SSCGs were retrieved from the work of Clevenger et al. [31]. The FPKM value of each gene was log2-transformed and displayed in the form of heat maps by HemI. The color scale in the lower right represents the relative expression level: green represents a low level, and red indicates a high level. Twenty different tissues are shown on top of the heat map. The SSCGs are listed on the right of the heat map.

