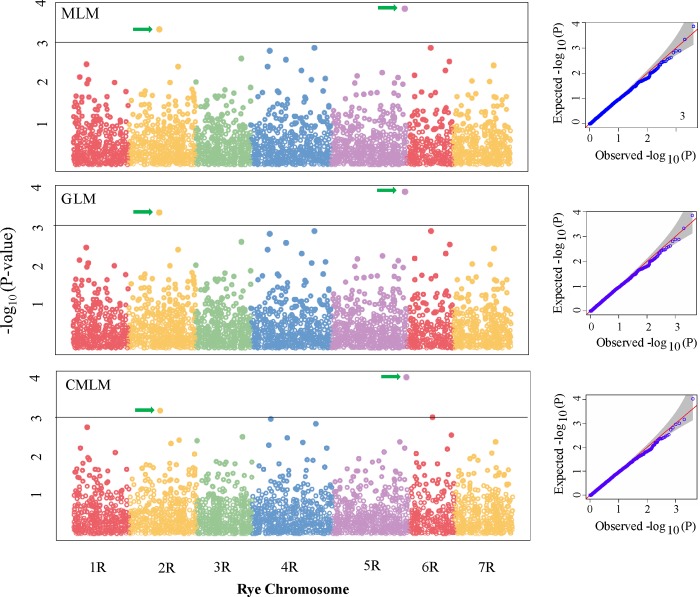
Fig 5. Genome-wide association scan for tan spot (PTR race 5) resistance in rye.
Three different model-based Manhattan plots represent–log10 (p-value) for SNPs distributed across all seven chromosomes of rye. Y-axis:–log10 (p-value) and x-axis: rye chromosomes. The dashed line stands as a threshold for significant markers with–log10 (p-value) of > 3 which correspond to a p-value <1 × 10⁻³. The arrows pointed two significant SNPs. On the right side of each model, Quantile-Quantile (QQ) plots represent expected null distribution of p-values vs observed p-values.

