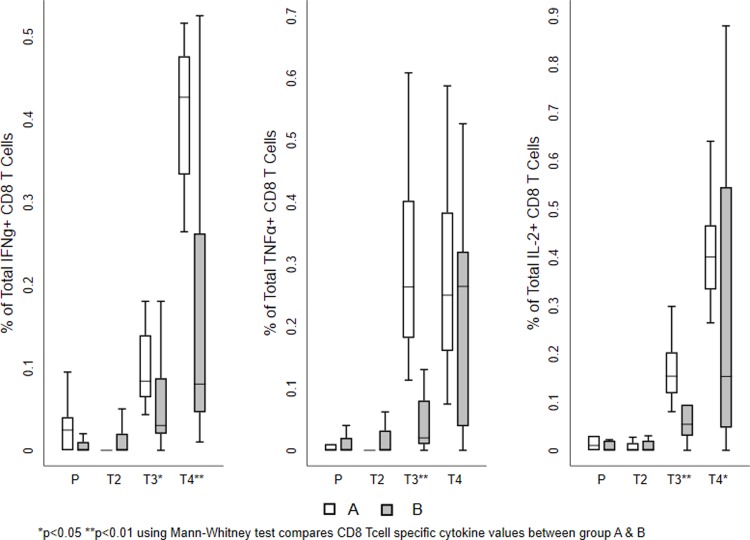
Fig 4. Vaccine-induced HIV-1-specific CD8+ T cell responses.
Frequency of vaccine-specific CD8+ T cells at different time points. The mean value of the total responses (Env, Gag, and Pol) obtained for each T cell sub population is shown. (A) Frequency of IFN-γ positive vaccine induced T cell subsets. (B) Frequency of TNF-α positive vaccine induced T cell subsets. (C) Frequency of IL-2 positive vaccine induced T cell sub populations. The box plots show the distribution of responses in positive responders only. The boxes indicate the median (solid line), mean (dashed line), and interquartile range (IQR). P values for significant differences were determined using the Mann-Whitney T test and are represented using the symbol *. (Note: P-Placebo, T2-Prevaccination, T3-Second week after first MVA vaccination, T4-Second week after last MVA vaccination).

