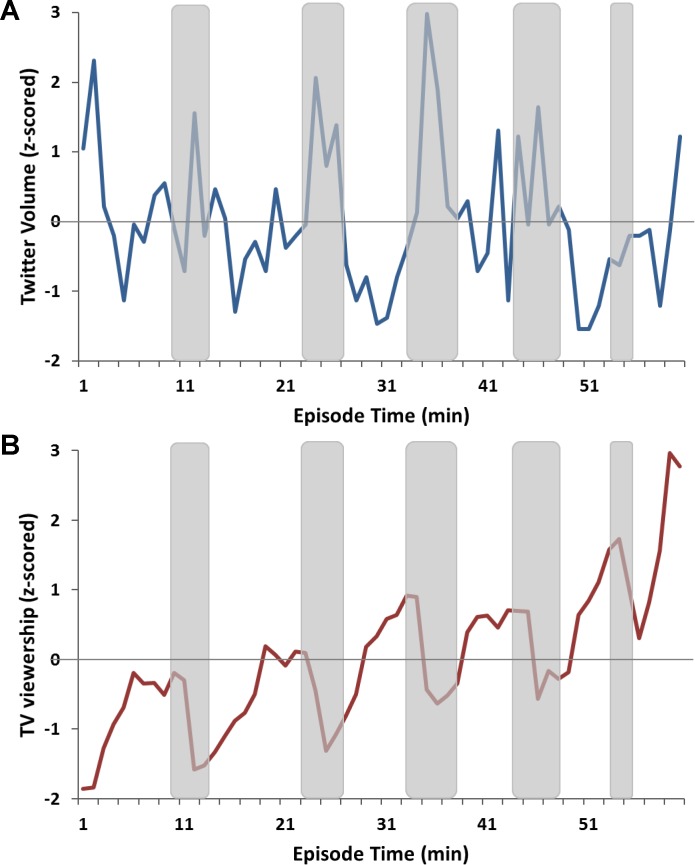
Fig 1. Minute-by-minute changes in Twitter volume and TV viewership across episode duration.
(A) Minute-by-minute changes in Twitter volume for a sample episode (NY Med). Shaded areas denote commercial breaks. Twitter activity increased during commercial breaks relative to show segments. (B) Minute-by-minute changes in viewership for a sample episode (NY Med). Shaded areas denote commercial breaks. TV viewership decreased during commercial breaks, with subsequent rebound during the next show segment. These patterns of Twitter and TV viewership fluctuations across the show duration were typical for most tested TV episodes; p = 0.03 for Twitter volume; p < 10−5 for TV viewership.

