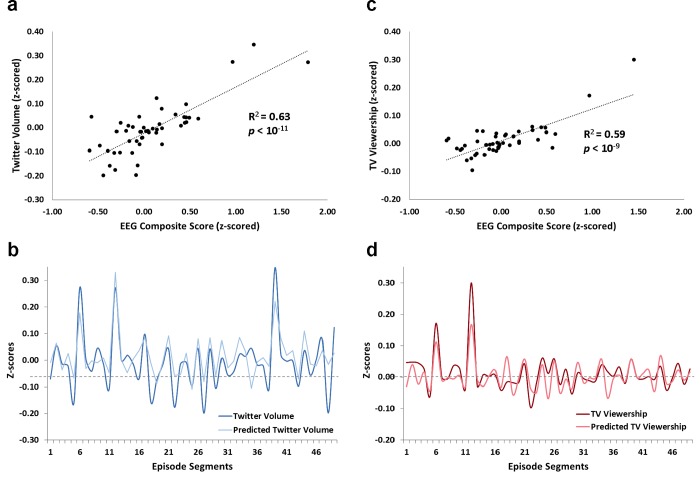
Fig 2. Composite EEG score predicts Twitter volume and TV viewership across program segments.
(A) Correlation between minute-by-minute changes in the composite EEG score (consisting of a z-scored average of the fronto-central left-to-right alpha/beta asymmetry, alpha power decrease/theta increase, and theta and gamma power increases) and Twitter volume across discrete program segments (n = 49). (B) Minute-by-minute changes in Twitter volume are plotted against changes in Twitter volume predicted based on the composite EEG score. (C) Correlation between minute-by-minute changes in composite EEG score and TV viewership across discrete program segments (n = 49). (D) Minute-by-minute changes in TV viewership are plotted against changes in Viewership predicted based on the composite EEG score.

