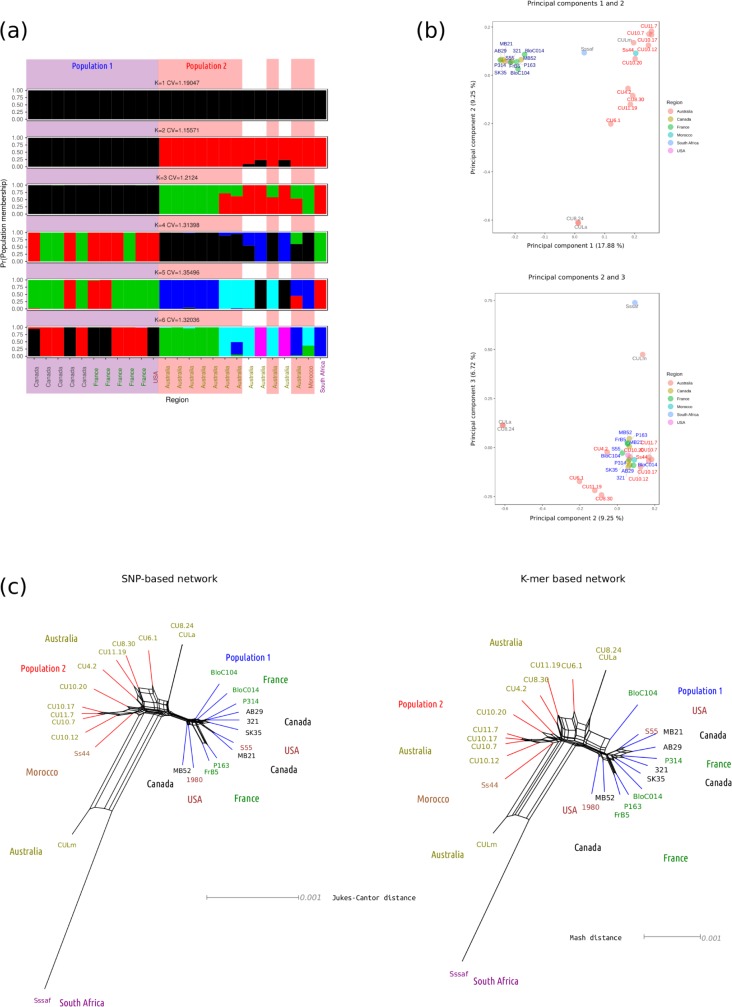
Fig 1. Analysis of population structure in a panel of 25 global isolates of Sclerotinia sclerotiorum.
(a) Population structures identified with K = 1..6 predefined populations. The y axis represents probability of population membership, the x axis represents different isolates (x axis labels are coloured according to isolate region of origin) and different colours represent the K = 1..6 populations. The number of populations with the lowest cross validation error was K = 2 (CV = 1.155). The two populations used throughout the selective sweep scans, population 1 (North American and European isolates) and population 2 (Australian isolates and a single Moroccan isolate) are blocked in blue and red shading, respectively. (b) Principal component analysis of population structure. Top panel: principal component 1 (17.88% of variance) is plotted on the x axis and principal component 2 (9.25% of variance) is plotted on the y axis. Points are coloured according to isolate region of origin (defined in the legend to the right) and labelled with isolate names in blue for population 1 membership and red for population 2 membership. The grey labels indicate that isolates were not included in further analyses as their genotypes were outliers with respect to the rest of the sample. Bottom panel: the same as for the top panel but for principal components 2 (9.25% of variance) and 3 (6.72% of variance). (c) Neighbor-net networks showing relatedness of isolates. Left panel: a SNP-based network derived from a genetic distance matrix produced using a whole genome alignment. Tip labels are coloured and labelled according to region of origin and branches are coloured according to whether the isolate is in population 1 (blue) or population 2 (red). The scale bar represents the Jukes-Cantor genetic distance. Right panel: the same as for the left panel but using a K-mer based approach. The scale bar represents Mash distance. Note that in both the left and right panel, the reference isolate ‘1980’, which was isolated from Soybean in the United States, is included. This is because its sequence was not implicit in the whole genome alignment as it was in the genotypic data used for Fig 1A and 1B.

