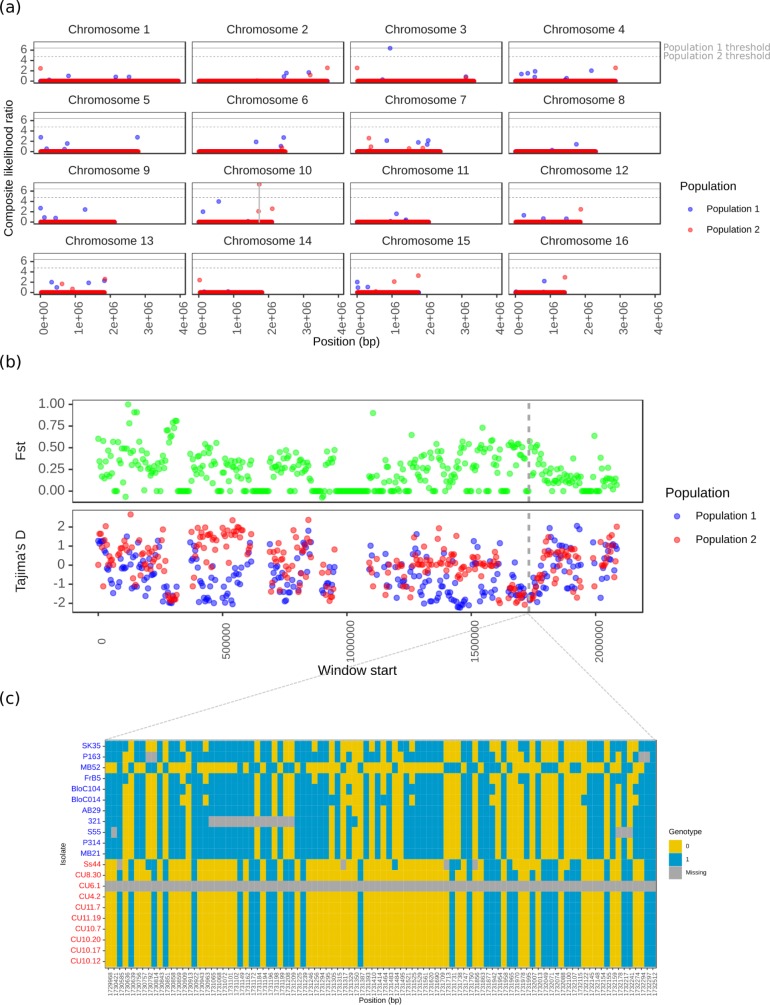
Fig 5. Selective sweep scan across the whole genome of Sclerotinia sclerotiorum.
(a) Composite likelihood ratio (CLR, y axis) of a selective sweep occurring at all sites (x axis) across each of the 16 Sclerotinia sclerotiorum reference chromosomes. The blue points are for population 1 (North American and European isolates) and the red points are for population 2 (Australian isolates and a single Moroccan isolate). The horizontal grey lines represent the threshold CLRs from coalescent simulations using the best fit models of population demography. The solid grey line is for population 1 and the dashed grey line is for population 2. A single candidate hard selective sweep above the coalescent simulation threshold was identified on chromosome 10. It occurred in population 2 and is marked out with solid vertical grey lines. (b) Fst (green points) and Tajima’s D (blue and red points for population 1 and 2, respectively) statistics (y axis) for 50 Kb end to end windows (window start is on the x axis) across chromosome 10, where the single selective sweep was identified. The two vertical dashed grey lines represent the site of the selective sweep. Though Fst was not obviously higher in this region, Tajima’s D was lower than average in both populations. (c) Haplotype plot of the selective sweep region on chromosome 10. Rows are isolates, labelled to the left in blue for population 1 and red for population 2, and columns are biallelic SNP markers, with positions labelled on the x axis. Coloured blocks represent genotype values of 0 (reference, in yellow), 1 (alternative, in blue), or missing (grey). This shows a clear lack of genotypic diversity in population 2, which likely caused the lowered Tajima’s D and elevated CLR statistics at this site.

