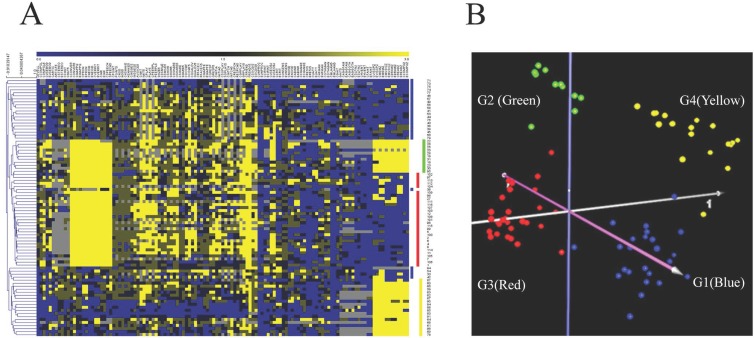
Fig 2. Cluster analysis of ADI-R scores of individuals with ASD.
(A) Hierarchical cluster analysis of 123 ADI-R scores of 85 individuals with ASD. Each column in the heat map represents each ADI-R question, whereas each row represents each individual with ASD. The colors in the heat map represent ADI-R scores and reflect the severity of that behavior/function, ranging from a lower score (blue, less severe) to a higher score (yellow, more severe). (B) Principal component analysis (PCA) of the ADI-R scores of 85 individuals with ASD used in this study revealed four distinct clusters (G1–G4). Each dot represents an individual with ASD.

