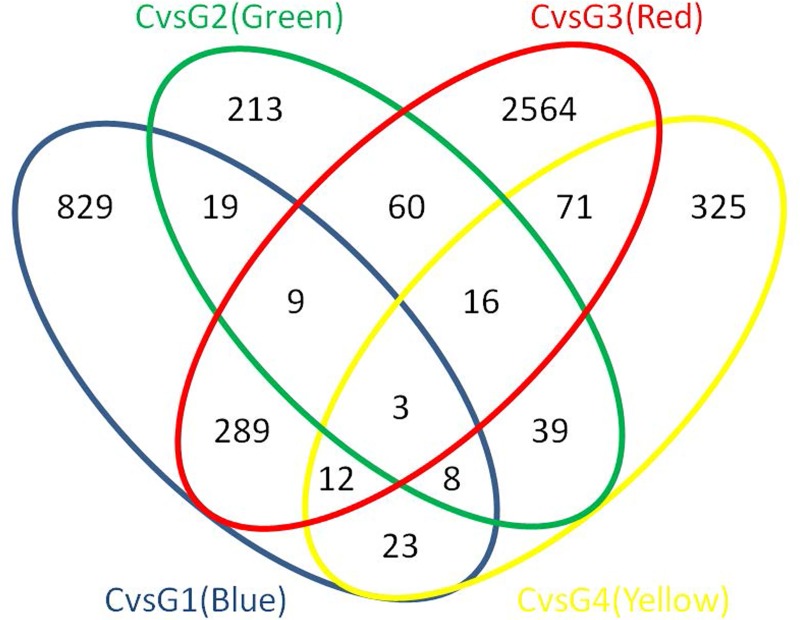
Fig 3. Overlap analysis of differentially expressed transcripts in the ASD phenotypic subgroups, as determined by the cluster analysis of ADI-R scores.
The Venn diagram shows differentially expressed transcripts across the identified ASD subtypes, with significance determined using t-tests with standard Bonferroni correction (P-value < 0.05).

