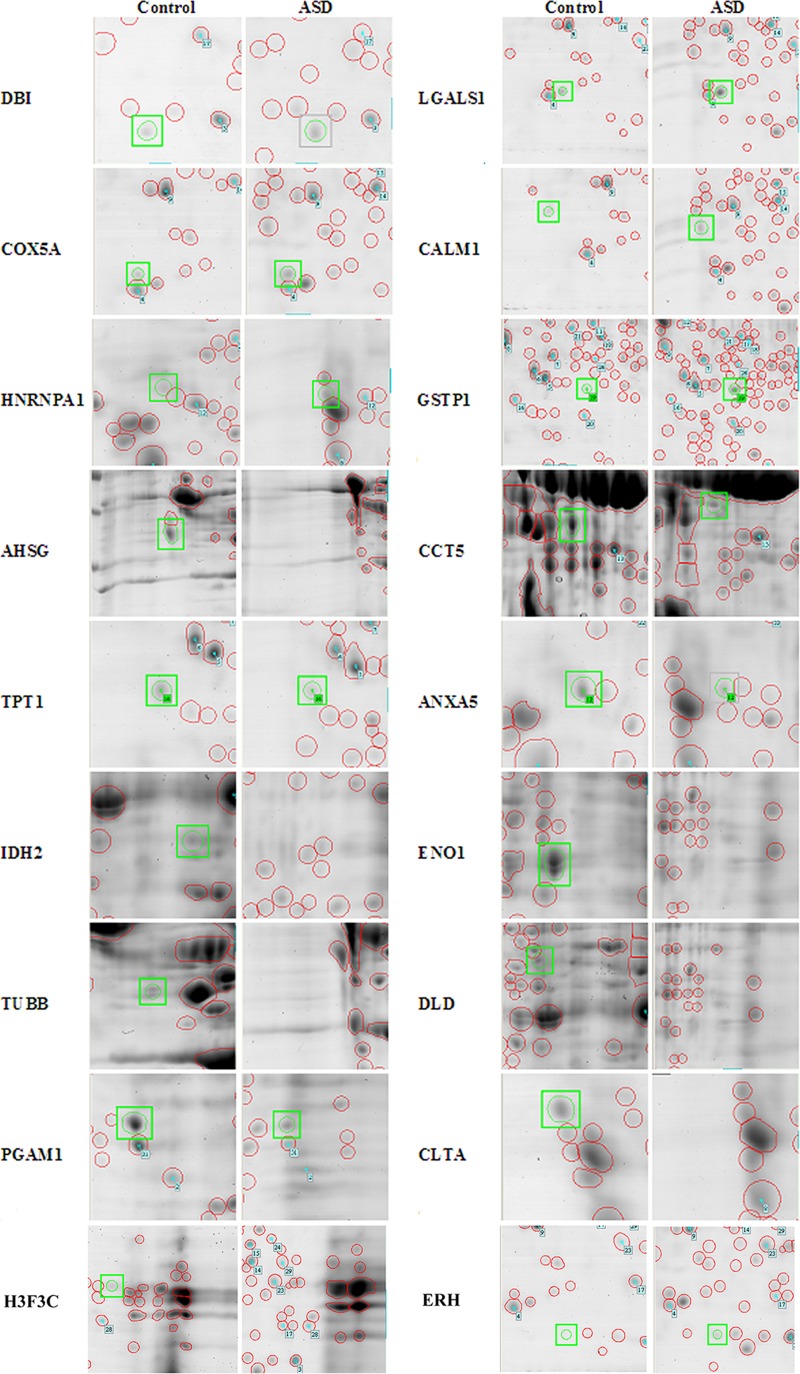
Fig 6. Differentially expressed protein spots in ASD with severe language impairment compared with age-matched controls.
Representative images show differentially expressed protein spots identified through 2D gel electrophoresis in the ASD with severe language deficit group compared with sex-/age-matched controls. The red circles show detectable proteins in the gel, and the green circles show significantly differentially expressed protein spots based on statistical analysis via ANOVA (P-value < 0.05).

