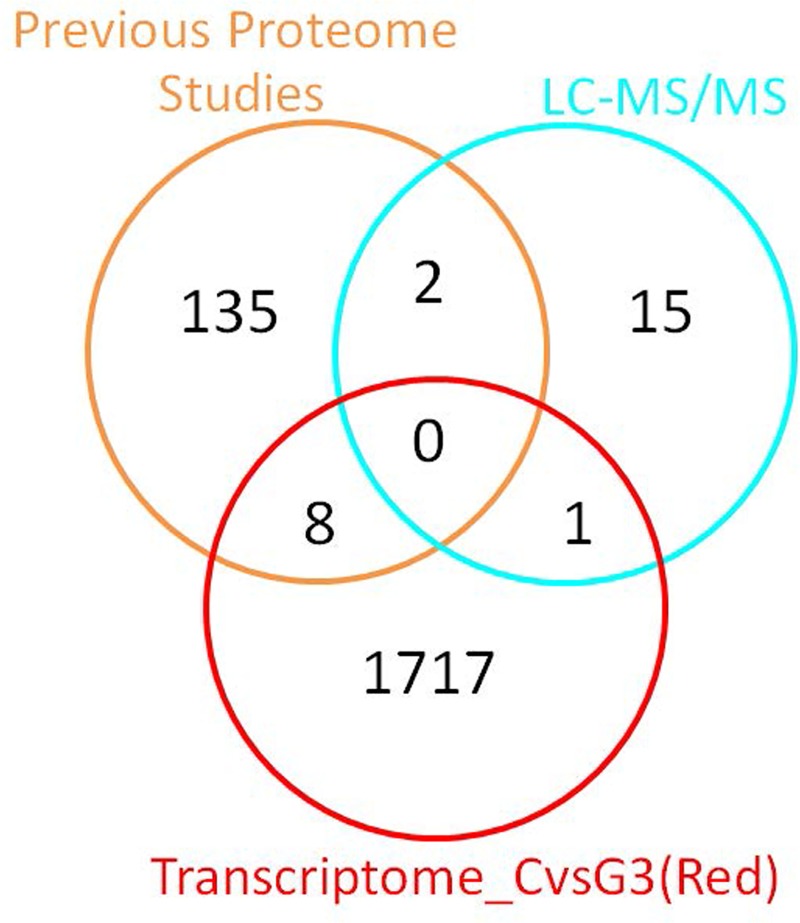
Fig 8. Overlap analysis of the top differentially expressed proteins identified via 2D-PAGE and LC-MS/MS analysis, differentially expressed transcripts, and significant proteins from previous proteomic studies.
This Venn diagram shows the number of overlapping transcripts/proteins among the three types of analyses. The list of significant proteins from previous proteomic studies was obtained from the studies listed in Table 2.

