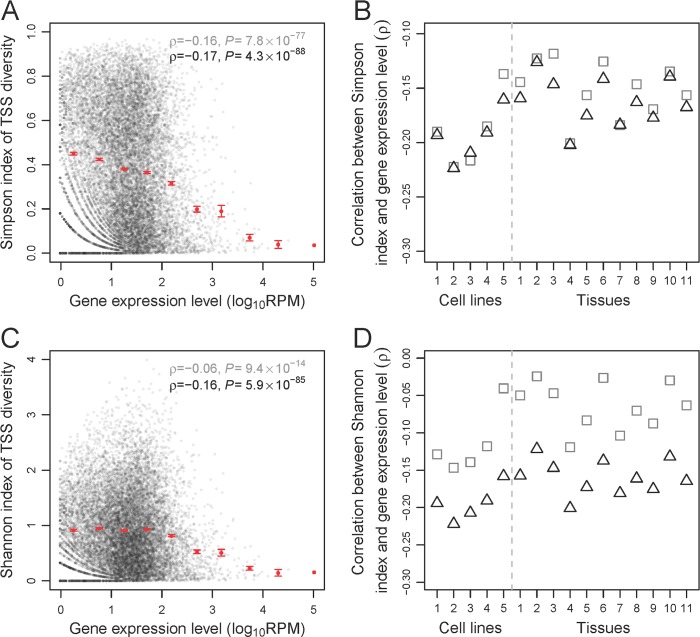
Fig 1. The TSS diversity of a gene generally decreases with the gene expression level.
(A) The Simpson index of TSS diversity of a gene in the human universal sample declines with the expression level of the gene in the sample. (B) Spearman's correlations between gene expression level and Simpson index of TSS diversity in each of five human cell lines and 11 human tissue samples examined. (C) The Shannon index of TSS diversity of a gene in the human universal sample declines with the expression level of the gene in the sample. (D) Spearman's correlations between gene expression level and Shannon index of TSS diversity in each human cell line and tissue sample examined. In (A) and (C), each black dot represents a gene. Spearman's rank correlation coefficient (ρ) and associated P-value are presented for the original unbinned data (gray) and down-sampled data (black), respectively. Each red dot shows the mean X-value and mean Y-value of the genes in each of 10 equal-interval bins (i.e., all bins have the same log10RPM interval), while the error bars show standard errors (error bar is absent when a bin contains only one gene). In (B) and (D), gray squares and black triangles show the correlations on the basis of the original unbinned data and down-sampled data, respectively. P < 5 × 10⁻³ for all correlations. Sample IDs listed on the x-axis refer to those in S1 Table. Data are available at https://github.com/ZhixuanXu/Nonadaptive-alternative-TSSs. ID, identifier; RPM, reads mapped to the gene per million reads; TSS, transcription start site.

