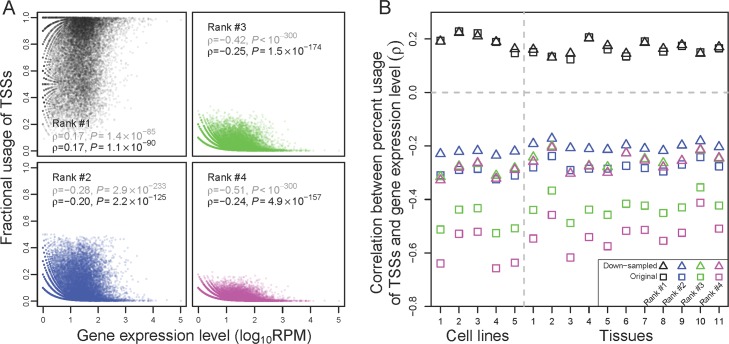
Fig 2. Increased fractional use of the most frequently used TSS of a gene and decreased fractional use of each other TSS when gene expression level rises.
(A) Spearman's correlation (ρ) between the expression level of a gene and the fractional uses of its TSSs in the human universal sample. TSSs are ranked on the basis of their fractional uses in the sample concerned, with rank #1 being the most frequently used one (major TSS). Each dot represents a gene. Gray and black ρ and P are based on the original and down-sampled data, respectively. (B) Spearman's rank correlation between the expression level of a gene and the fractional uses of its TSSs in each human cell line or tissue sample examined. P < 10−39 in all cases. Squares and triangles show the correlations on the basis of the original and down-sampled data, respectively. In both panels, the correlation for TSSs with a particular rank is calculated using the genes that have at least that particular number of TSSs. Sample IDs listed on the x-axis of (B) refer to those in S1 Table. Data are available at https://github.com/ZhixuanXu/Nonadaptive-alternative-TSSs. ID, identifier; RPM, reads mapped to the gene per million reads; TSS, transcription start site.

