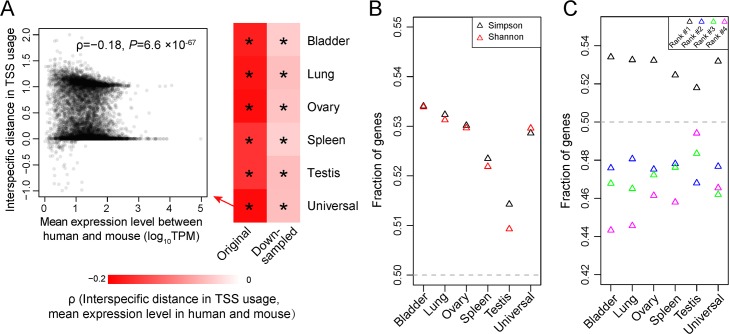
Fig 4. TSS usages of human–mouse orthologous genes in each of six tissue samples.
(A) Spearman's correlations between the mean expression level of a gene in the two species and its interspecific distance in TSS usage. All correlations are negative; those significant at P = 0.05 are indicated by an asterisk. The scatter plot of the human–mouse comparison of the universal sample is presented as an example. (B) The fraction of genes for which the Simpson or Shannon index of TSS diversity is lower in the species where the gene expression level is higher. All fractions significantly exceed the random expectation of 50% (P < 0.05) except for those in the testis. (C) Fraction of genes for which the percent usage of the TSS of a particular rank is higher in the species where the gene expression level is higher. All fractions deviate significantly from the random expectation of 50% (P < 0.05). In (B) and (C), down-sampled data are used. Data are available at https://github.com/ZhixuanXu/Nonadaptive-alternative-TSSs. TPM, transcripts per million; TSS, transcription start site.

