
Fig 1. Population map of Kedah, Malaysia showing spatial distribution of melioidosis cases.
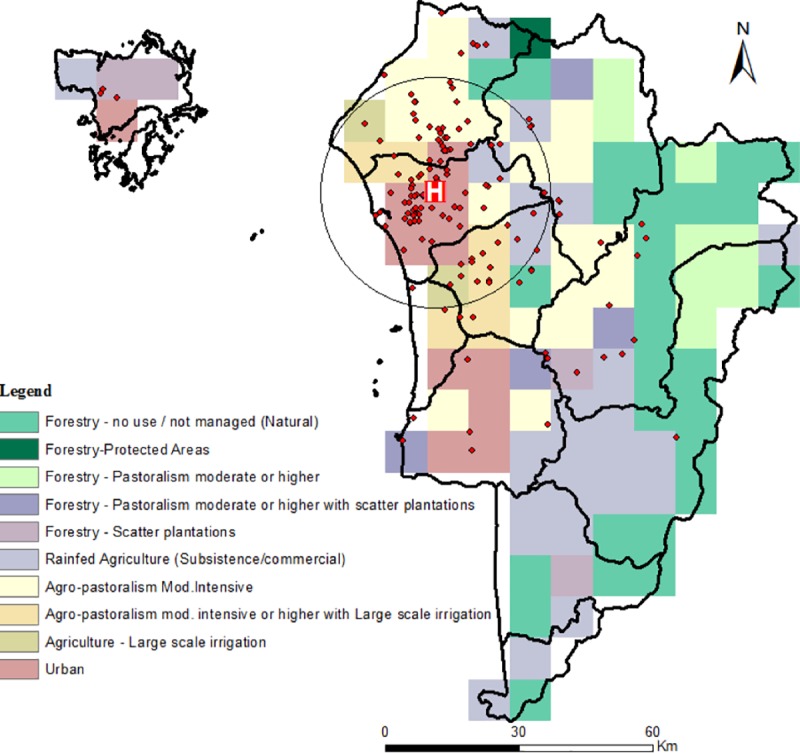
Red block with “H” represents Hospital Sultanah Bahiya (HSB). Spatial scan statistic revealed the most likely disease cluster, black triangle (radius 0.23, p<0.001). No significant secondary clusters were discovered. Created with ArcGIS 10.1 [18] using district boundaries provided by the Department of Statistics, Malaysia. Land cover and population map layers were generated as described in Methods.