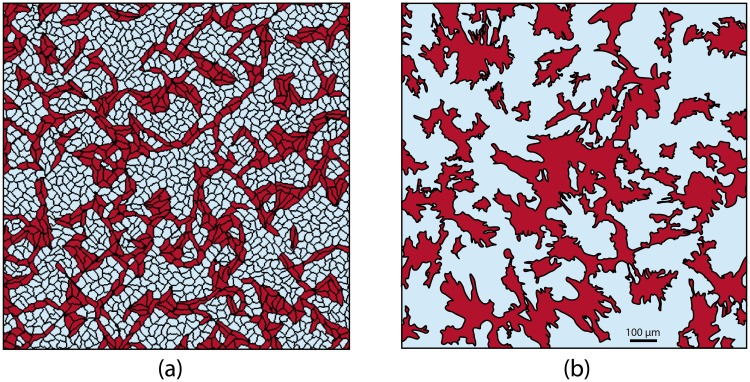
Fig 5. The branching pattern obtained in a computer model (a) compared to one observed in an experiment (b).
(a) A virtual sample with 70% of non-conducting cells. (b) A segmented image of the experimental sample with 66% of non-conducting cells. The original image is shown in Fig 2.

