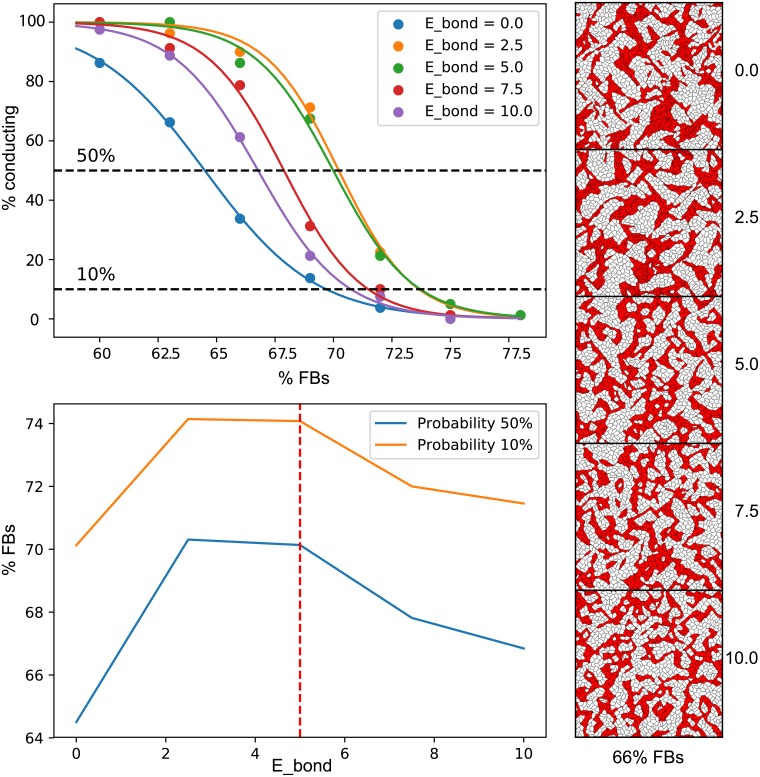
Fig 7. Optimal value of Ebond.
The top-left panel shows the probability of full connectivity in the sample (5 x 5 mm samples, connected from top to bottom and from left to right) depending on the percentage of non-conducting cells. Values of Ebond are shown with different colours. Each point corresponds to the average probability in 40 generated samples. The data was fitted with sigmoid functions. The bottom-left panel shows the percentages of non-conducting cells that correspond to 50% and 10% probability of connected network formation in a sample depending on the value of Ebond. These plots show, that there exists an optimal value of Ebond that provides the highest chance of network formation. On the right, examples of connected networks with 66% non-conducting cells and different values of Ebond are shown. Cardiomyocytes are shown in red, and non-conducting fibroblasts in white.

