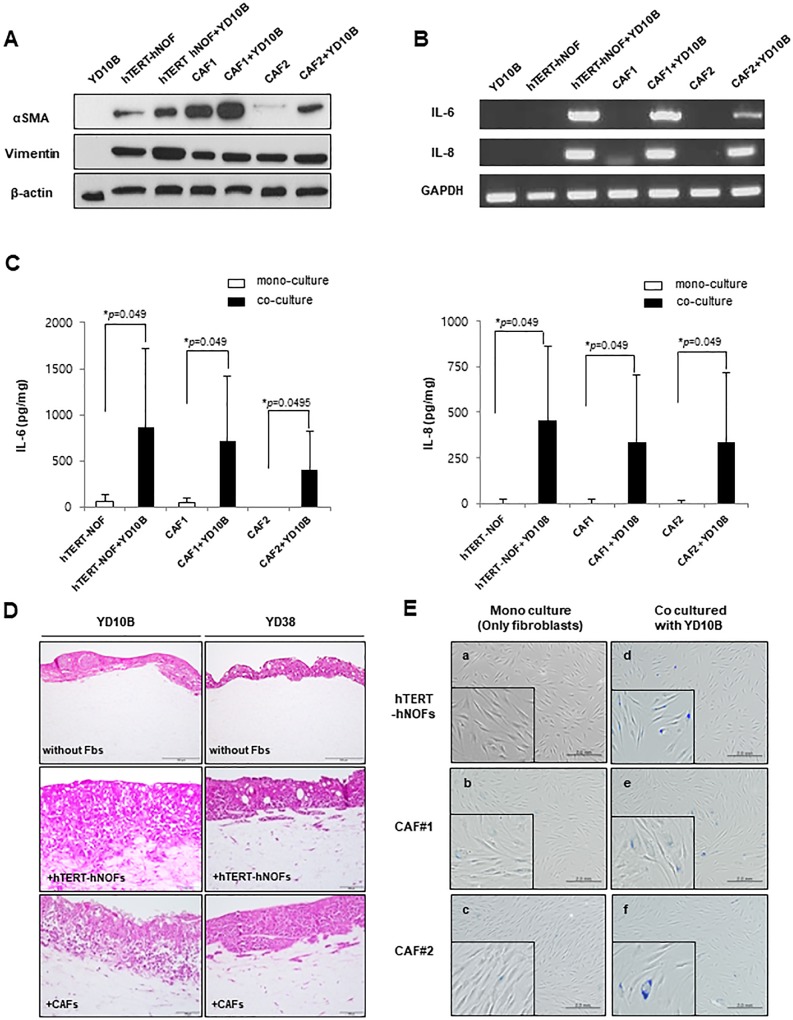
Fig 1. CAF like characteristics in hTERT-hNOFs by co-culturing with OSCC cells.
(A) Expression of αSMA and vimentin in fibroblasts (hTERT-hNOFs and CAFs) mono-cultured and co-cultured with OSCC YD10B cells for 48 h. Cell lysates were prepared, and then Western blot were performed. (B) Cells grown in the presence or absence of YD10B OSCC cells. After 24h, the cells were harvested and detected mRNA expression of IL-6 and IL-8. (C) After 24h, conditioned medium was collected and the secretion levels of IL-6 and IL-8were measured by ELISA. The results were normalized for total protein and expressed as pg/mg of protein. This assay was performed in independent triplicate repeats (*p < 0.05; Mann-Whitney U test). (D) Representative images are shown to observe OSCC cells (YD10B and YD38) invaded toward stromal proportion with or without fibroblasts (hTERT-hNOFs and CAF#1) in 3D culture conditions. The mixture of each fibroblast and collagen was put into Mill-cell and grown for 14 days. Thereby, the rafts were fixed, embedded in paraffin, sectioned and stained using hematoxylin and eosin. (200x magnification, Scale bar: 100 μm, respectively). (E) SA-β-Gal assay was performed and representative microscopic pictures (a) mono-cultured hTERT-hNOFs (left, top), (d) hTERT-hNOFs, co-cultured with YD10B OSCC cells (right, top), (b) CAF#1 mono cultured (left, middle) and (e) co cultured with YD10B OSCC cells (right, middle) and (c) CAF#2 mono cultured(left, bottom) and (f) co cultured with YD10B OSCC cells (right, bottom) are shown at 72 h (magnification: 200X, scale bar: 2.0 mm). Enlarged images are shown in the bottom of each left.

