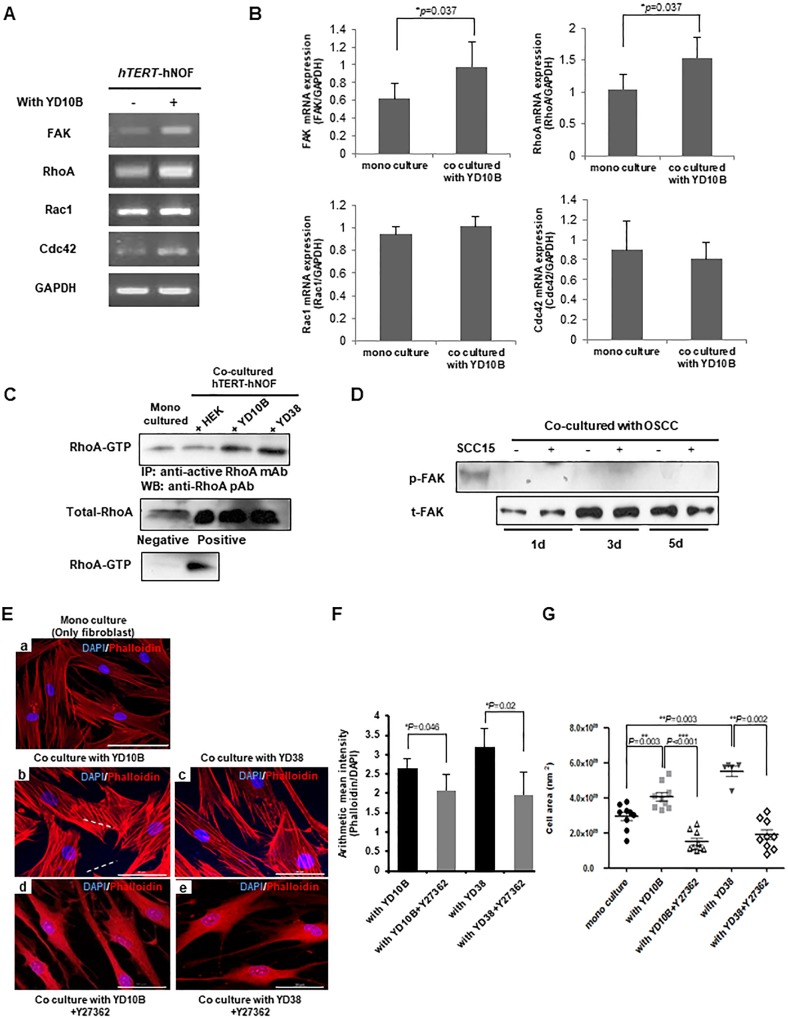
Fig 3. RhoA modulates cytoskeletal alteration in fibroblasts adjacent to OSCC cells.
(A) hTERT-hNOFs were grown with YD10B OSCC cells for 24 h and then Rho GTPase family gene expression was identified by RT-PCR. (B) Quantification of Rho GTPase mRNA expression was shown. Each gene was normalized with ratio of GAPDH expression. The experiments were performed in three-independent (*p < 0.05; Mann-Whitney U test). (C) RhoA-GTP expression in hTERT-hNOFs mono-cultured and co-cultured with HEK or OSCC cells. Cell lysates were harvested at 24 h and then RhoA-GTP pull down assay was performed. (D) hTERT-hNOFs was grown with YD10B OSCC cells for indicated time. The phosphorylation of FAK(Tyr397) was identified by western blot. SCC 15 tongue SCC was used as a positive control of phospho-FAK. (E) All immunofluorescence microscopy experiments were performed on cultured cell after 3days. DAPI(blue), F-actin(Phalloidin)(red) and Merged staining were shown in mono-cultured hTERT-hNOF(left, top) and hTERT-hNOF co cultured with YD10B OSCC cell (left, middle), YD38 OSCC cell (right, middle), YD10B OSCC cell + Y27632(ROCK inhibitor, 10μg/ml) (left, bottom) and YD38 OSCC cell + Y27632(ROCK inhibitor, 10μg/ml) (right, bottom), Scale bar, 50μm. (F) The mean intensity of Phalloidin (F-actin) was shown. It was normalized by dividing the intensity of DAPI in cells (*p < 0.05; Mann-Whitney U test). (G) Cell size was measured by using ZEN 2012 software program. (mono cultured, n = 9; with YD10B, n = 9; with YD10B+Y27632, n = 9; with YD38, n = 5; with YD38+Y27632, n = 9) (*p < 0.05, **p < 0.01, ***p < 0.001; Mann-Whitney U test).

