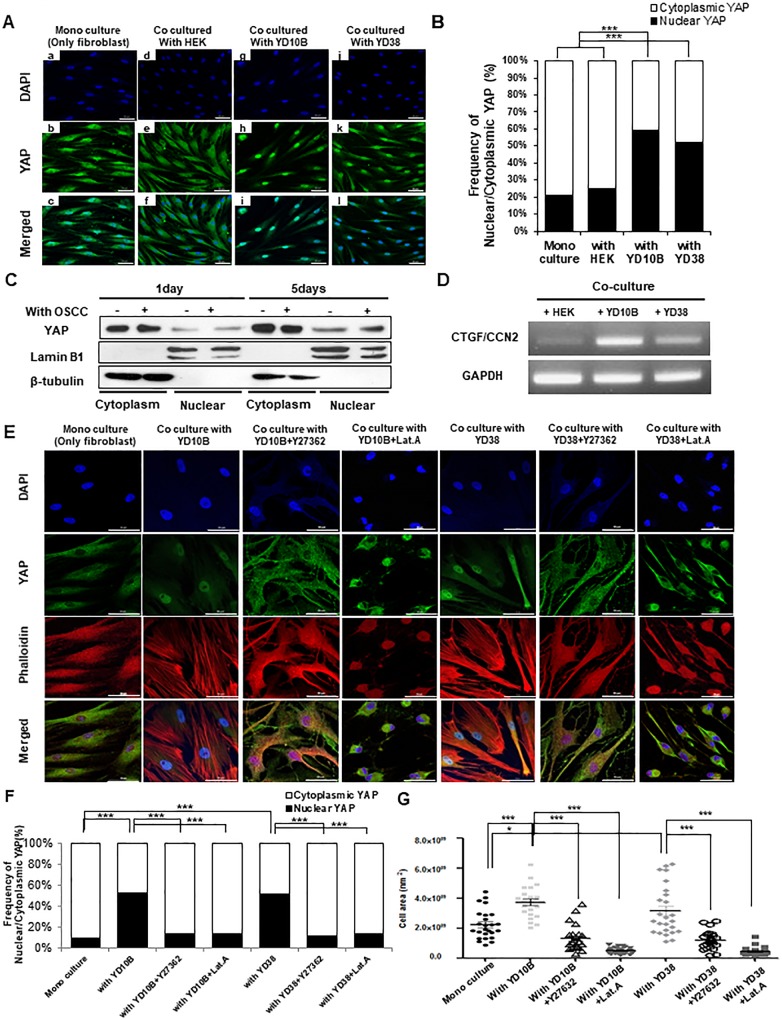
Fig 4. Nuclear accumulation of YAP was increased in CAFs.
(A)All immunofluorescence microscopy experiments were performed on cultured cell after 3days. DAPI(blue), YAP(green) and Merged staining are shown in mono-cultured hTERT-hNOF(first panels) and hTERT-hNOF co cultured with HEK (second panels), YD10B OSCC cell (third panels) and YD38 OSCC cell (fourth panels), Scale bar, 50μm. (B) Graph summarizing the distribution of YAP was shown. It was analyzed by Image J software program (hTERT-hNOFs mono cultured, n = 67; co cultured with HEK, n = 53; with YD10B, n = 60; with YD38, n = 61, ***p< 0.001; student t test). (C) hTERT-hNOFs were grown with or without YD10B OSCC cell for indicated time. Nuclear/cytoplasmic fraction was isolated from each protein and then western blot was performed to check the YAP distribution. Lamin B1 was used as a positive control of nuclear protein fraction and β-tubulin was used as a positive control of cytoplasmic protein fraction. Nuclear/cytoplasmic YAP expression was normalized to each nuclear/cytoplasmic positive control. (D) hTERT-hNOFs were grown with OSCC cells or HEK cell for 3 days. YAP target gene; CTGF, was identified by RT-PCR. (E)All immunofluorescence microscopy experiments were performed on cultured cell after 3days. DAPI(blue), Phalloidin(red) YAP(green) and Merged staining are shown in mono-cultured hTERT-hNOF(first line) and hTERT-hNOF co cultured with YD10B OSCC cell (second line), with YD10B OSCC cell + Y27362 (third line), with YD10B OSCC cell + Lat.A (fourth line), with YD38 OSCC cell (fifth line), with YD38 OSCC cell +Y27362 (six line) and with YD38 OSCC cell + Lat.A (seven line), Scale bar, 50μm. (F) Graph summarizing the distribution of YAP was shown. It was analyzed by Image J software program (mono culture, n = 26; with YD10B, n = 13; with YD10B+Y27362, n = 35; with YD10B+Lat.A, n = 38; with YD38, n = 24; with YD38+Y27632, n = 34; with YD38+Lat.A, n = 39) (***p < 0.001; student t test). (G) Cell size was measured by using ZEN 2012 software program. (mono culture, n = 25; with YD10B, n = 22; with YD10B+Y27362, n = 24; with YD10B+Lat.A, n = 25; with YD38, n = 26; with YD38+Y27632, n = 24; with YD38+Lat.A, n = 25) (*p < 0.05, **p < 0.01, ***p < 0.001; student t test).

