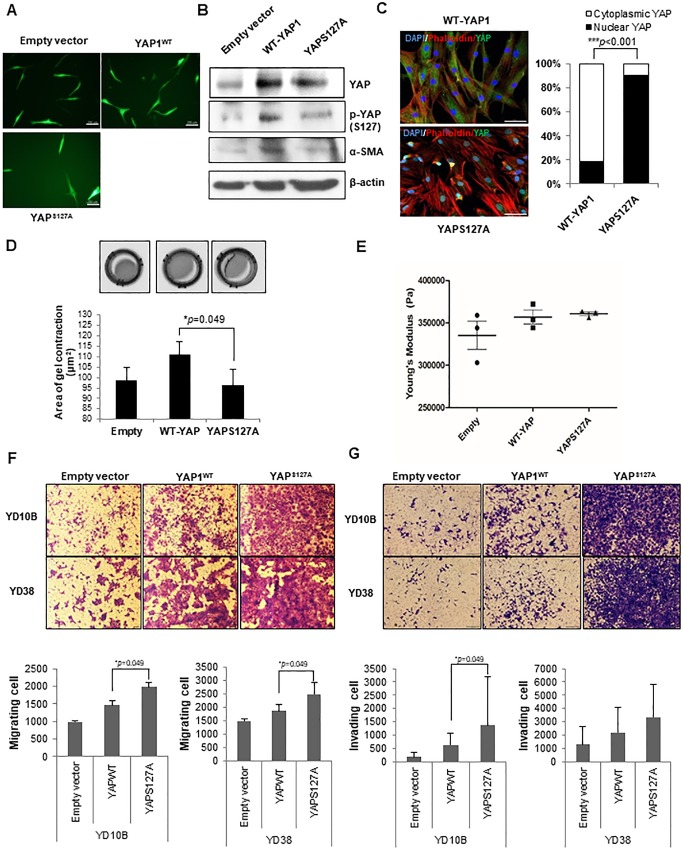
Fig 5. YAPS127A fibroblasts rearrange ECM structures and promote motility and invasiveness of OSCC cells.
(A) Fluorescence microscope was used to check the expression of EGFP on cultured cell after transfection with pcDNA4-HisMaxB-YAP1 and YAPS127A, Scale bar, 200μm. (B) The YAP, p-YAP(S127) and αSMA protein expression was identified in all transfected cells (empty-, WT-YAP-, YAPS127A transfected hTERT-hNOFs) by Western blot. (C) Immunofluorescence images were shown in WT-YAP1- and YAPS127A-hTERT-hNOFs. Merged stained Images (DAPI(blue), F-actin(Phalloidin)(red), YAP(green))are shown. Scale bar, 50μm. The bar graph indicates the distribution of YAP in WT-YAP1- and YAPS127A-hTERT-hNOFs. It was analyzed by Image J software program (WT-YAP1-hTERT-hNOFs, n = 40; YAPS127A-hTERT-hNOFs, n = 40) (***p < 0.001; Student t test). (D) The representative images show gel contractility by the fibroblasts. Histogram shows mean value ± SD (n = number of gels (Empty, 3; WT-YAP, 3; YAPS127A, 3), assessed over multiple experiments (*p < 0.05; Mann Whitney U test). (E) Histogram shows elastic modulus of matrix remodeled by fibroblasts, respectively. Each data point represents a single measurement, (n = 3, respectively) measurements in total. Line and error bars indicate mean value ± SD. (F-G) Representative images showed the (F) migration and (G) invasion of OSCC cells (YD10B and YD38) cultured with each of fibroblasts, which were transfected with Empty-, WT-YAP-, YAPS127A-transfected hTERT-hNOFs). Quantification of OSCC cells (YD10B and YD38) migration toward lower chamber is shown as bar graphs. Each assay was performed in independent triplicate repeats (*p < 0.05; Mann-Whitney U test).

