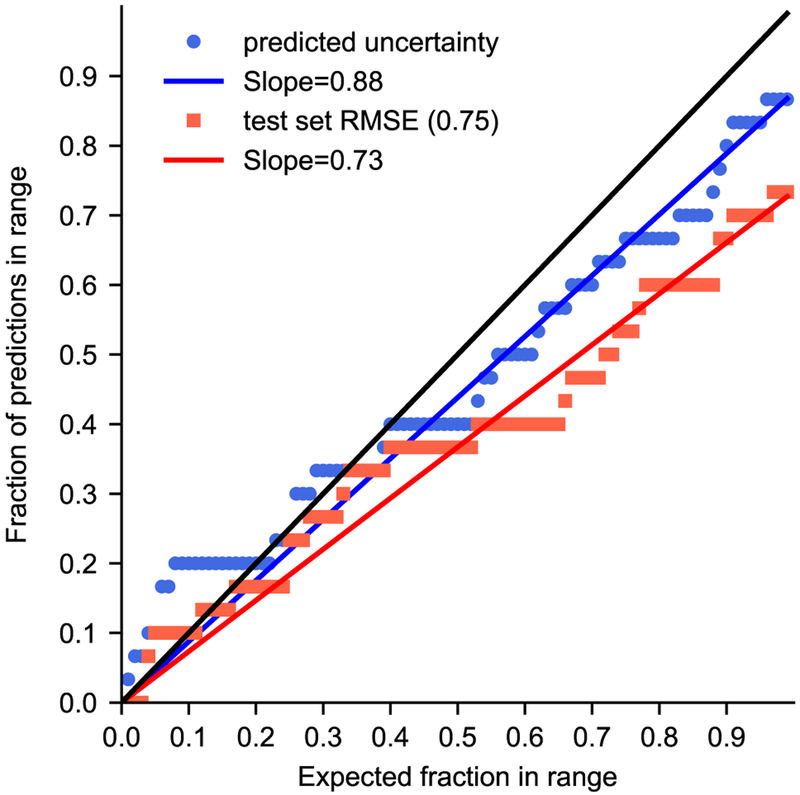
Fig. 9.
This QQ plot provides an assessment for predicted uncertainties compared to a normal distribution. Our predicted uncertainties (blue circles) out perform a fixed error of 0.75 taken from our test set RMSE (red squares), as evident by the proximity of the point to the x = y black line and a slope approaching one.

