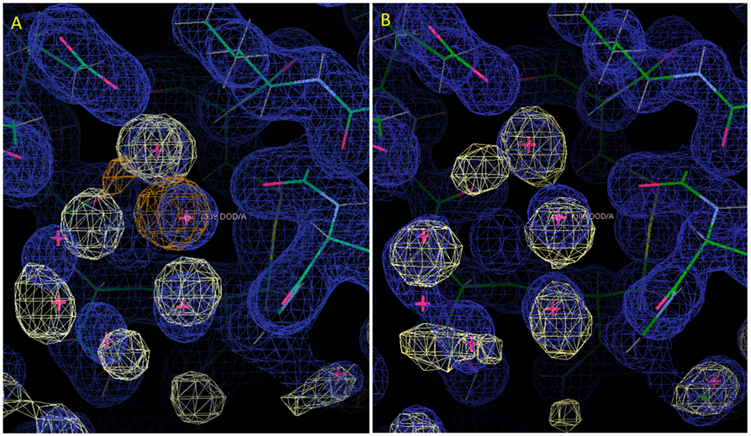
Figure 4.
Comparison of alternative solvent models in the neighborhood of water 309. (A) Restrained NaCl model. (B) Restrained Tris-Cl model in a similar orientation. Rendering of the MD water and X-ray 2Fo-Fc maps are as in Fig. 2. Panel (A) also includes the Na+ density, rendered in orange at a level of 8-sigma. In the NaCl model (A), the position of water 309 is occupied by a Na+ ion, and there are substantial differences between the MD and crystallographic water structure nearby. In the Tris-Cl model (B), the MD water structure overlaps water 309, and the neighboring water structure is more similar between the MD and the crystallographic water structure. The panels were created using Coot39.

