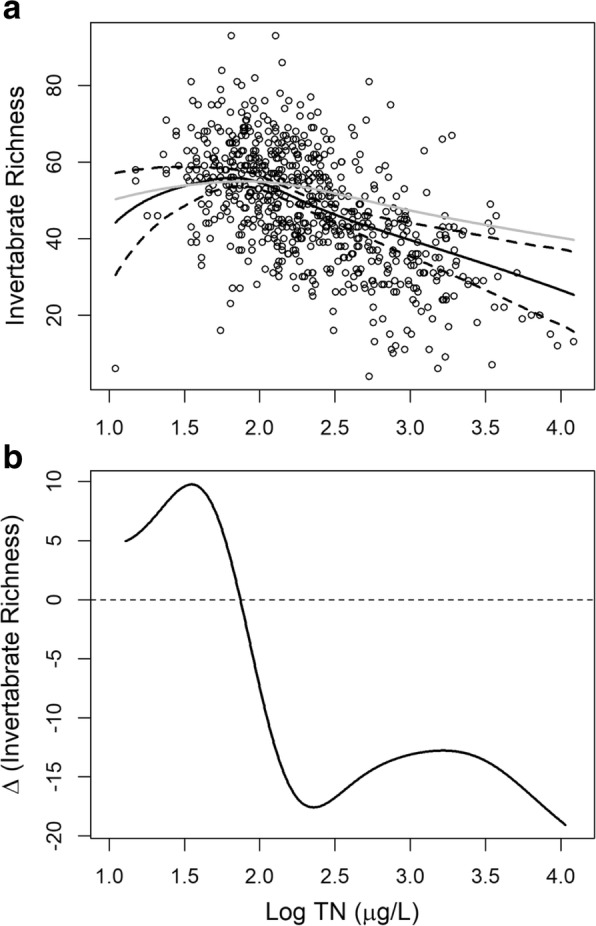
Fig. 3.

a The regional causal effects of total nitrogen on invertebrate richness in the Western United States. The black solid line and the black dashed lines are the mean estimations by generalized propensity score of the TN-IR dose-response function and the corresponding 95% confidence boundaries, respectively. The gray solid line is the estimation by GAM. b The change rate (slope) of invertebrate richness at different nitrogen levels
